Oracle Data Guard 23c comes with many nice improvements for observability, which greatly increase the usability of Data Guard in environments with a high level of automation.
For the 23c version, we have the following new views.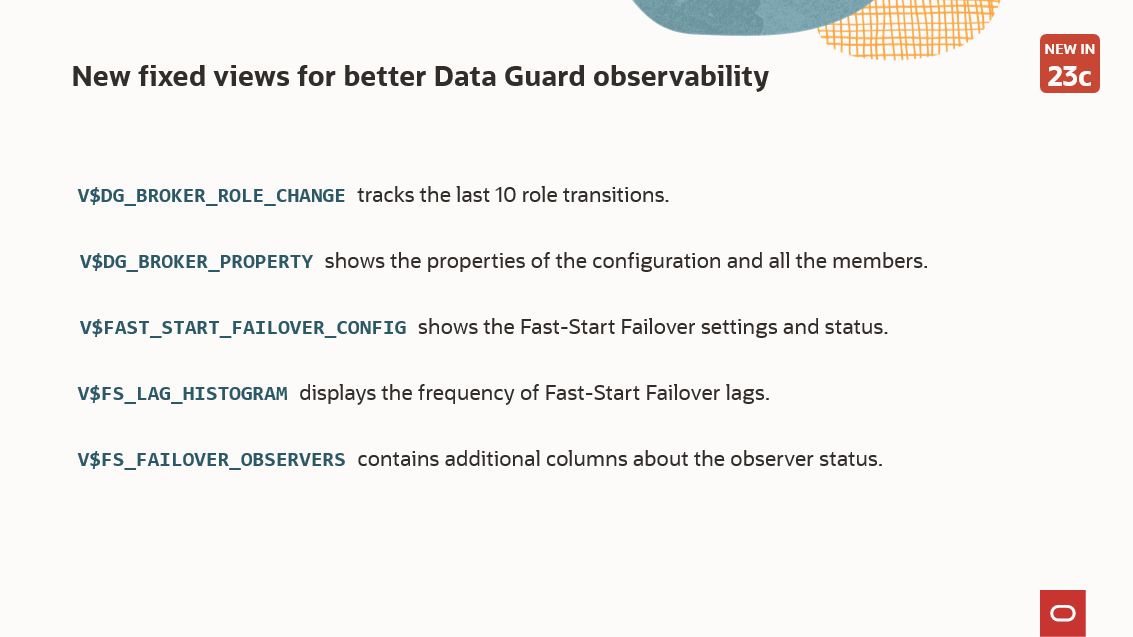 V$DG_BROKER_ROLE_CHANGE
This view tracks the last role transitions that occurred in the configuration. Example:
|
1 2 3 4 5 6 |
SQL> select * from v$dg_broker_role_change; EVENT STANDBY_TYPE OLD_PRIMARY NEW_PRIMARY FS_FAILOVER_REASON BEGIN_TIME END_TIME CON_ID _____________ _______________ _________________ _________________ _____________________ __________________________________ __________________________________ _________ Switchover Physical adghol_53k_lhr adghol_p4n_lhr 18-DEC-23 10.40.12.000000000 AM 18-DEC-23 10.40.32.000000000 AM 0 Switchover Physical adghol_p4n_lhr adghol_53k_lhr 18-DEC-23 10.48.55.000000000 AM 18-DEC-23 10.49.15.000000000 AM 0 |
The event might be a Switchover, Failover, or Fast-Start Failover.
In the case of Fast-Start Failover, you will see the reason (typically “Primary Disconnected” if it comes from the observer, or whatever reason you put in DBMS_DG.INITIATE_FS_FAILOVER.
No more need to analyze the logs to find out which database was primary at any moment in time!
V$DG_BROKER_PROPERTY
Before 23c, the only possible way to get a broker property from SQL was to use undocumented (unsupported) procedures in the fixed package DBMS_DRS. I’ve blogged about it in the past, before joining Oracle.
Now, it’s as easy as selecting from a view, where you can get the properties per member or per configuration:
|
1 2 3 4 5 6 7 8 9 10 11 12 13 14 15 16 17 18 19 20 21 22 23 24 25 26 |
SQL> select member, property, value from V$DG_BROKER_PROPERTY where value is not null; MEMBER PROPERTY VALUE ___________ _______________________________ _________ mydb FastStartFailoverThreshold 180 mydb OperationTimeout 30 mydb TraceLevel USER mydb FastStartFailoverLagLimit 300 mydb CommunicationTimeout 180 mydb ObserverReconnect 0 mydb ObserverPingInterval 0 mydb ObserverPingRetry 0 mydb FastStartFailoverAutoReinstate TRUE mydb FastStartFailoverPmyShutdown TRUE ... mydb_site1 DGConnectIdentifier mydb_site1 mydb_site1 FastStartFailoverTarget mydb_site2 mydb_site1 LogShipping ON mydb_site1 LogXptMode ASYNC mydb_site1 DelayMins 0 ... mydb_site1 StaticConnectIdentifier (DESCRIPTION=<...>))) mydb_site1 TopWaitEvents (monitor) mydb_site1 SidName (monitor) mydb_site2 DGConnectIdentifier mydb_site2 mydb_site2 FastStartFailoverTarget mydb_site1 |
The example selects just three columns, but the view is rich in detailing which properties apply to which situation (scope, valid_role):
|
1 2 3 4 5 6 7 8 9 10 11 12 13 14 15 16 17 18 19 20 21 22 23 24 25 26 27 28 29 30 31 32 33 34 35 36 37 38 39 40 41 42 43 44 45 46 47 |
SQL> set sqlformat json-formatted SQL> select * from v$dg_broker_property where member='adghol_p4n_lhr' and upper(property) like '%REDO%'; { "results" : [ { ... "items" : [ { "member" : "adghol_p4n_lhr", "instance" : "N/A", "dataguard_role" : "PHYSICAL STANDBY", "property" : "PreferredObserverHosts", "property_type" : "CONFIGURABLE", "value" : "", "value_type" : "STRING", "scope" : "MEMBER", "valid_role" : "N/A", "con_id" : 0 }, { "member" : "adghol_p4n_lhr", "instance" : "N/A", "dataguard_role" : "PHYSICAL STANDBY", "property" : "RedoRoutes", "property_type" : "CONFIGURABLE", "value" : "", "value_type" : "STRING", "scope" : "MEMBER", "valid_role" : "N/A", "con_id" : 0 }, { "member" : "adghol_p4n_lhr", "instance" : "N/A", "dataguard_role" : "PHYSICAL STANDBY", "property" : "RedoCompression", "property_type" : "CONFIGURABLE", "value" : "DISABLE", "value_type" : "STRING", "scope" : "MEMBER", "valid_role" : "STANDBY", "con_id" : 0 } ] } ] } |
The monitorable properties can be monitored using DBMS_DG.GET_PROPERTY(). I’ll write a blog post about the new PL/SQL APIs in the upcoming weeks.
I wish I had this view when I was a DBA 🙂
V$FAST_START_FAILOVER_CONFIG
If you have a Fast-Start Failover configuration, this view will show its details:
|
1 2 3 4 5 6 |
SQL> SELECT fsfo_mode, status, current_target, threshold, observer_present, observer_host, 2> protection_mode, lag_limit, auto_reinstate, observer_override, shutdown_primary FROM V$FAST_START_FAILOVER_CONFIG; FSFO_MODE STATUS CURRENT_TARGET THRESHOLD OBSERVE OBSERVER_HOST PROTECTION_MODE LAG_LIMIT AUTO_ OBSER SHUTD ___________________ ______________________ ______________ _________ _______ _____________ ________________ _________ _____ _____ _____ POTENTIAL DATA LOSS TARGET UNDER LAG LIMIT mydb_site2 180 YES mydb-obs MaxPerformance 300 TRUE FALSE TRUE |
This view replaces some columns currently in v$database, that are therefore deprecated:
|
1 2 3 4 5 6 7 8 9 10 11 12 |
SQL> desc v$database Name Null? Type _______________________________ ________ ________________ ... FS_FAILOVER_MODE VARCHAR2(19) FS_FAILOVER_STATUS VARCHAR2(22) FS_FAILOVER_CURRENT_TARGET VARCHAR2(30) FS_FAILOVER_THRESHOLD NUMBER FS_FAILOVER_OBSERVER_PRESENT VARCHAR2(7) FS_FAILOVER_OBSERVER_HOST VARCHAR2(512) ... |
V$FS_LAG_HISTOGRAM
This view is useful to calculate the optimal FastStartFailoverLagTime.
|
1 2 3 4 5 6 7 8 9 10 11 12 13 |
SQL> select * from v$fs_lag_histogram; THREAD# LAG_TYPE LAG_TIME LAG_COUNT LAST_UPDATE_TIME CON_ID ---------- ----------- ---------- ---------- -------------------- ---------- 1 APPLY 5 122 01/23/2023 10:46:07 0 1 APPLY 10 5 01/02/2023 16:12:42 0 1 APPLY 15 2 12/25/2022 12:01:23 0 1 APPLY 30 0 0 1 APPLY 60 0 0 1 APPLY 120 0 0 1 APPLY 180 0 0 1 APPLY 300 0 0 1 APPLY 65535 0 0 |
It shows the frequency of Fast-Start Failover lags and the most recent occurrence for each bucket.
LAG_TIME is the upper bound of the bucket, e.g.
- 5 -> between 0 and 5 seconds
- 10 -> between 5 and 10 seconds
- etc.
It’s refreshed every minute, only when Fast-Start Failover is enabled (also in observe-only mode).
V$FS_FAILOVER_OBSERVERS
This view is not new, however, its definition now contains more columns:
|
1 2 3 4 5 6 7 8 9 10 11 12 13 14 15 16 17 18 |
SQL> desc v$fs_failover_observers Name Null? Type ------------------------------ -------- ----------------- NAME VARCHAR2(513) REGISTERED VARCHAR2(4) HOST VARCHAR2(513) ISMASTER VARCHAR2(4) TIME_SELECTED TIMESTAMP(9) PINGING_PRIMARY VARCHAR2(4) PINGING_TARGET VARCHAR2(4) CON_ID NUMBER -- new in 23c: LAST_PING_PRIMARY NUMBER LAST_PING_TARGET NUMBER LOG_FILE VARCHAR2(513) STATE_FILE VARCHAR2(513) CURRENT_TIME TIMESTAMP(9) |
This gives important additional information about the observers, for example, the last time a specific observer was able to ping the primary or the target (in seconds).
Also, the path of the log file and runtime data file are available, making it easier to find them on the observer host in case of a problem.
Conclusion
These new views should greatly improve the experience when monitoring or diagnosing problems with Data Guard. But they are just a part of many improvements we introduced in 23c. Stay tuned for more 🙂
—
Ludovico