
I put here the steps required to install and access Weblogic in the OCI (mostly for me in case I need to do it again 😉 ). The assumptions are:
- you already have an account for the Oracle Cloud Infrastructure and you can access the OCI console
- you already have a Compartment with a VCN and a subnet configured (for test purposes, a VCN created with the default values will be just fine)
- you already have a keypair for your SSH client (id_rsa, id_rsa.pub)
- you have an X server on your laptop (if you have Windows, I recommend MobaXTerm, but Xming or other servers are just fine)
Create the compute instance
- Menu -> Core Infrastructure -> Compute -> Instances -> Create Instance
- Choose a name for the Instance, all the other fields defaults are fine for test (Oracle Linux 7.6, VM.Standard2.1, etc.)
- Paste your SSH public key
- Optionally, under advanced/network, specify a different name for the VM
- Click on Create to complete the creation
At some point you will have an instance “Green” ready to access:
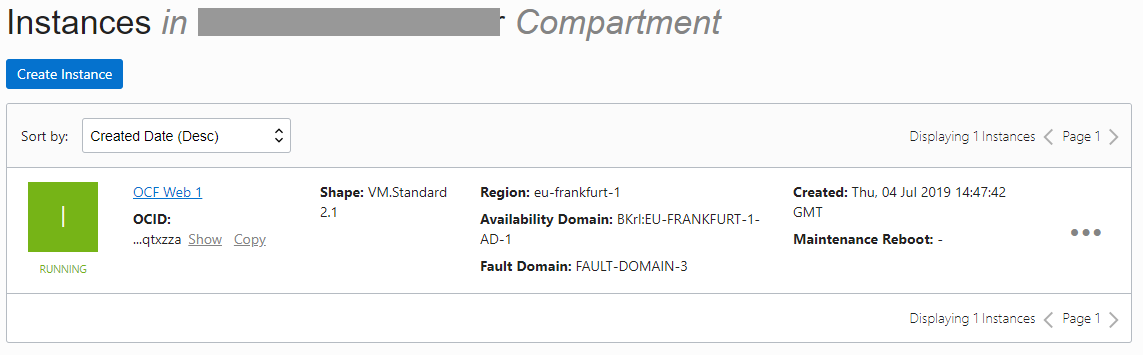
Click on it and get the public address:
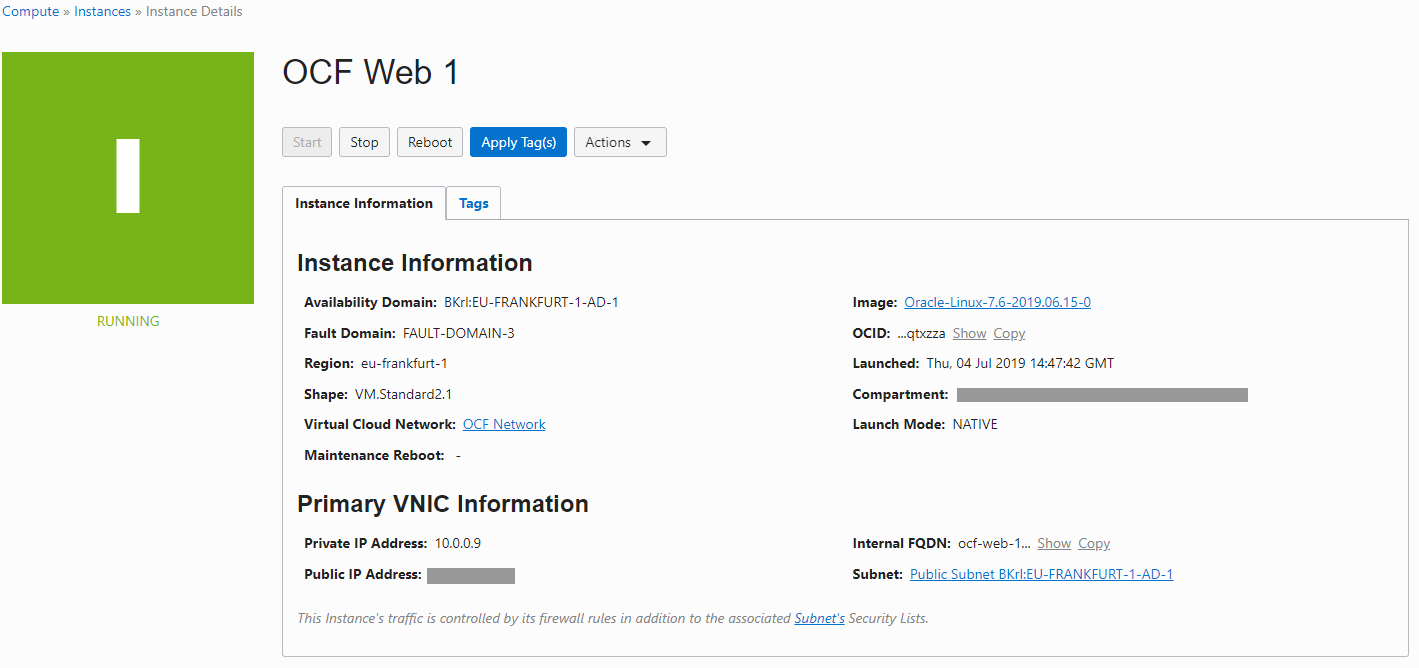
Using your SSH keypair, you can now access the instance with:
|
1 |
$ ssh opc@{public_ip} |
Setup sshd for SSH tunneling and X11 forwarding
Edit as root the sshd_config:
|
1 |
$ sudo vi /etc/ssh/sshd_config |
Modify it so that the following lines are present with these values:
|
1 2 3 4 5 |
AllowTcpForwarding yes PermitOpen any X11Forwarding yes X11DisplayOffset 10 X11UseLocalhost no |
Those values are required for X11 forwarding (required for the graphical installation) and for SSH tunneling (required to access the Weblogic ports without exposing them over internet).
Then restart sshd:
|
1 |
$ sudo systemctl restart sshd |
Install the packages for X11
|
1 2 3 4 |
# sudo yum install xorg-x11-xauth.x86_64 # sudo yum install libXtst # # optional, to test if X11 forwarding works # sudo yum install xterm |
At this point, it should be possible to forward X11. You can test by reconnecting with:
|
1 |
$ ssh -XC opc@{public_ip} |
and then:
|
1 |
$ xterm |
Create the oracle user
|
1 2 3 4 |
$ sudo su - root # groupadd -g 54321 oinstall # useradd -u 54321 -g oinstall oracle # passwd oracle |
At this point, you can reconnect using oracle directly, so X11 forward will work for the oracle user without any additional setup:
|
1 |
$ ssh -XC oracle@{public_ip} |
Follow the canonical steps to install weblogic
If you do not know how to do that, follow this good tutorial by Tim Hall (oracle-base):
Oracle WebLogic Server (WLS) 12cR2 (12.2.1) Installation on Oracle Linux 6 and 7
Access the Weblogic console from outside Oracle Cloud
If you configured correctly sshd, once the Oracle Weblogic instance is configured and started, you can tunnel to the port (it should be 7001):
|
1 |
$ ssh -L 7001:{vm_name}:7001 oracle@{public_ip} |
And be able to browse from your laptop using localhost:7001:
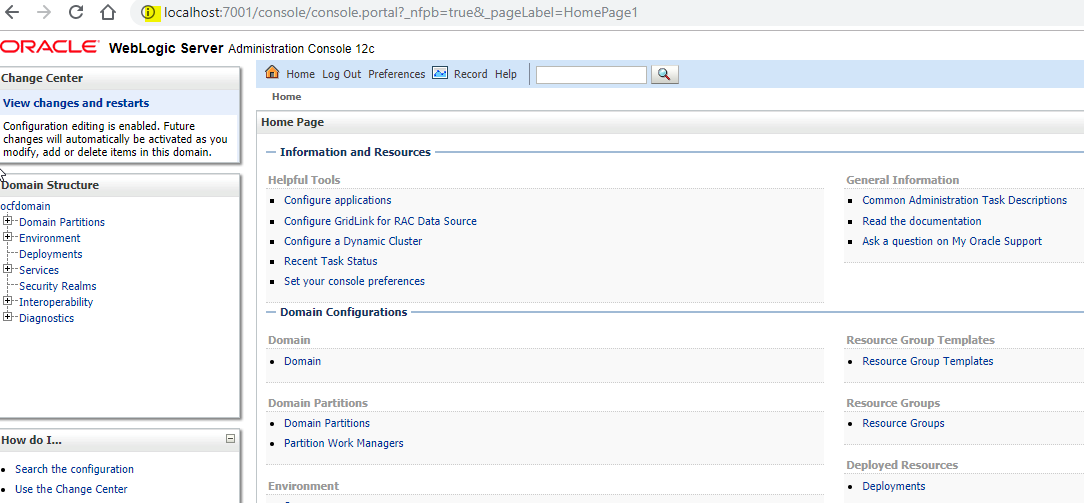
HTH
—
Ludovico
