BP and Patch 22652097: set optimizer_adaptive_statistics to FALSE explicitly or it might not work!

Update 14.03.2018: After some exchanges with Nigel Bayliss, the behaviour described here has been filed as unpublished bug 27626925: OPTIMIZER ADAPTIVE STATS DEFAULT FALSE NOT HONORED WHEN ENABLED IN OCT OR JAN BP. It will be fixed starting with April’s bundle patch.


According to Nigel’s blog post:

The Oracle 12.1.0.2 October 2017 BP and the Adaptive Optimizer

if you installled the patch 22652097 prior to apply the Bundle Patch 171018, the BP apply in the database should recognize that the patch was already in place and keep it activated. This is done through the fix control 26664361.

When fix_control 26664361:0 -> Patch 22652097 is not enabled: the parameter optimizer_adaptive_features (OAF) works

When fix_control 26664361:1 -> Patch 22652097 is enabled; optimizer_adaptive_features is discarded and the two new parameters have the priority: optimizer_adaptive_plans (OAP) and optimizer_adaptive_statistics (OAS).

But at my customer, I had another behavior.

My patching story might be very similar to yours!

When I started upgrading my customer’s database to 12c in early 2015, I experienced very soon the infamous problems with SQL Plan Directives (SPD) and Adaptive Dynamic Sampling (ADS) that I described in my paper: ADAPTIVE FEATURES OR: HOW I LEARNED TO STOP WORRYING AND TROUBLESHOOT THE BOMB .

Early fixes

When I was new to the problem, the quick fix for the problematic applications was to set OAF to FALSE.

Later, I discovered some more details and decided to opt for setting:

In other cases, I disabled the specific directives that were causing problems.

But many databases did not have so many problems, and I left the defaults.

Patch 22652097 on top of BP170718 

At some point, me and my customer decided to apply the fix 22652097, on top of BP170718 that was our current patch level at that time.

The patch installation on a test database was complaining about the optimizer_adaptive_feature set: this parameter was not used anymore. This issue is nicely explained by Flora in her post Patch 22652097 in 12.1 makes optimizer_adaptive_features parameter obsolete.

In order to apply that patch on the remaining databases, we did:

  • alter system reset optimizer_adaptive_features;
  • alter system reset “_optimizer_dsdir_usage_control”;
  • Applied the patch on binaries and datapatch on the databases.

The result at this point was that:

  • optimizer_adaptive_features was not set
  • optimizer_adaptive_plans was set to true
  • optimizer_adaptive_statistics was set to false.

It might seems superflous to say, but it’s not, the SQL Plan Directives were not used anymore: no Adaptice Dynamic Sampling and no performance problems.

Bundle Patch 180116

Three weeks ago, we installled the last Bundle Patch in order to fix some Grid Infrastructure problems, and the BP, as described in Nigel’s note (and Mike Dietrich and many other bloggers :-)) contains the patch 22652097.

According to Nigel’s post, the patch installation should have detected that the patch 22652097 was already there and activate it.

And indeed, after we applied the BP, the fix_control 26664361 was set to 1 (that means that the patch 22652097 is enabled). So we went live with this setup without additional checks.

One week later, we started experiencing performance problems again. I noticed immediately that the Adaptive Dynamic Sampling was very aggressive again, and the SQL Plan Directives used again.

But the fix was there AND ENABLED!

After a few tests, I realized that the SPD is not used anymore if I set optimizer_adaptive_statistics EXPLICITLY to false.

optimizer_adaptive_statistics must be set explicitly, the default does not work

And here’s the proof:

I use once again the great SPD example by Tim Hall (sorry Tim, it’s not the first time that I steal your work 🙂 ) . You can find here:

SQL Plan Directives in Oracle Database 12c Release 1 (12.1)

After applying the BP, I have the default parameter, not set explicitly, and the fix_control enabled:


If I run the test statement (again, find it here https://oracle-base.com/articles/12c/sql-plan-directives-12cr1) the directives are used:


but then I set the parameter explicitly:

and the SPD usage (and consequently, ADS), are gone:

Conclusion

Set the parameter EXPLICITLY when you apply the BP that contains the fix.

And ALWAYS test the behavior!

You can check how many statements use the dynamic sampling by following this short blog post by Dominic Brooks:

Which of my sql statements are using dynamic sampling?

HTH

Which Oracle Databases use most CPU on my server?

Assumptions

  • You have many (hundreds) of instances and more than a couple of servers
  • One of your servers have high CPU Load
  • You have Enterprise Manager 12c but the Database Load does not filter by server
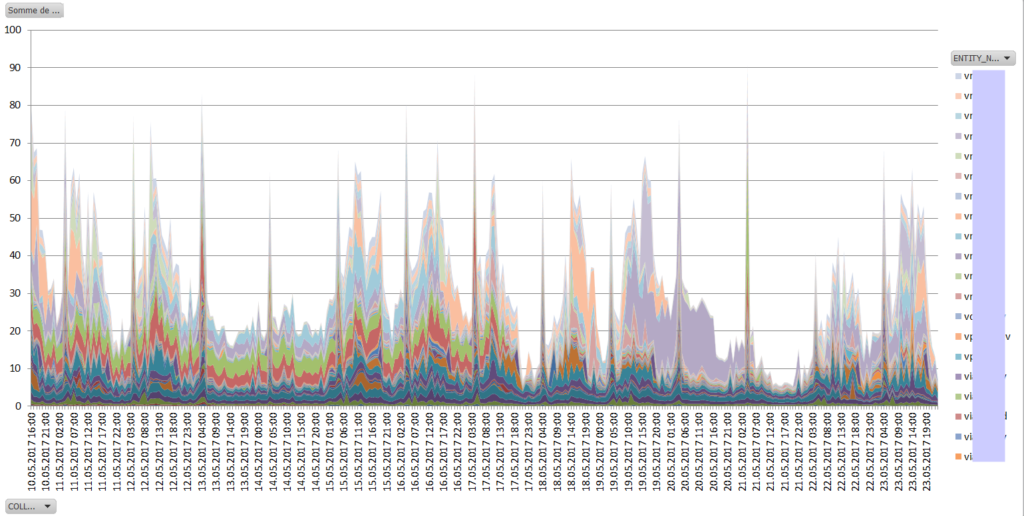
  • You want to have an historical representation of the user CPU utilization, per instance

Getting the data from the EM Repository

With the following query, connected to the SYSMAN schema of your EM repository, you can get the hourly max() and/or avg() of user CPU by instance and time.

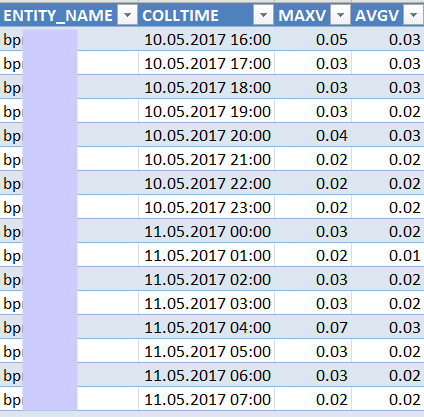
Suppose you select just the max value: the result will be similar to this:


Putting it into excel

There are one million ways to do something more reusable than excel (like rrdtool scripts, gnuplot, R, name it), but Excel is just right for most people out there (including me when I feel lazy).

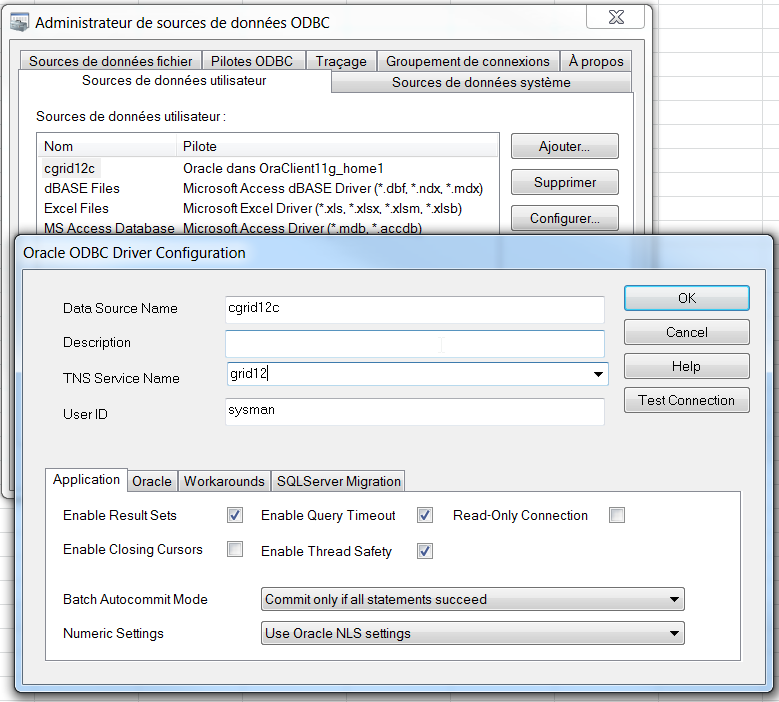
  • Configure an Oracle Client and add the ODBC data source to the EM repository:

odbc_emrep

  • Open Excel, go to “Data” – “Connections” and add a new connection:
    • Search…
    • New Source
    • DSN ODBC
  • Select your new ODBC data source, user, password
  • Uncheck “Connection to a specific table”
  • Give a name and click Finish
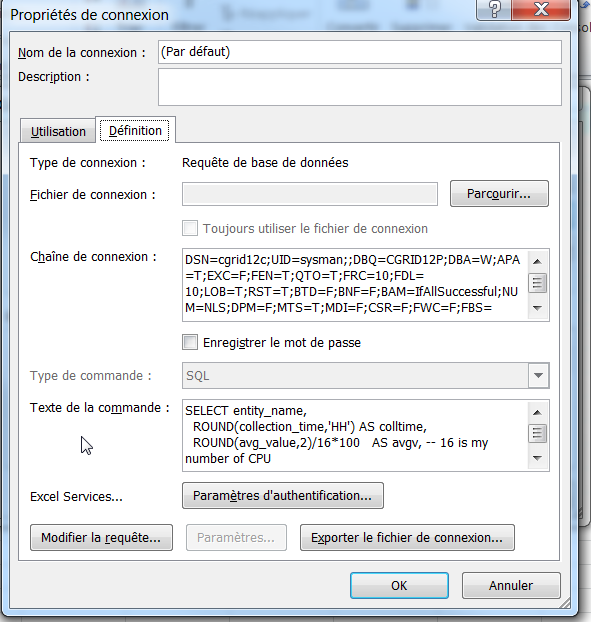
  • On the DSN -> Properties -> Definition, enter the SQL text I have provided previously

connection_properties_odbc_excel

The result should be something similar: ( but much longer :-))

first_step_excelPivoting the results

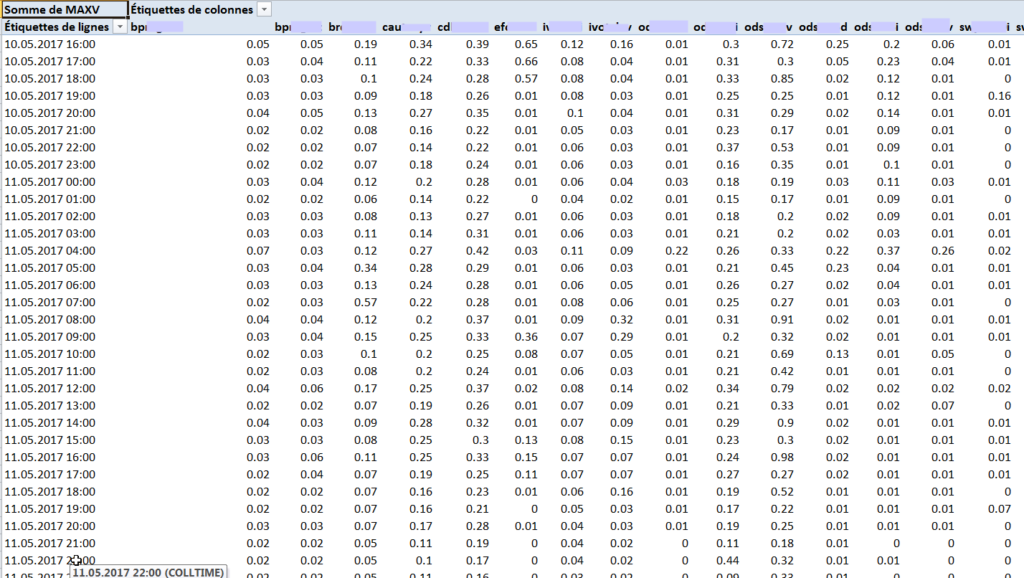
Create e new sheet and name it “pivot”, Click on “Create Pivot Table”, select your data and your dimensions:

pivotThe result:

pivotedCreating the Graph

Now that the data is correctly formatted, it’s easyy to add a graph:

just select the entire pivot table and create a new stacked area graph.

The result will be similar to this:

graph_cpu_load_excel

With such graph, it is easy to spot which databases consumed most CPU on the system in a defined period, and to track the progress if you start a “performance campaign”.

For example, you can see that the “green” and “red” databases were consuming constantly some CPU up to 17.05.2017 and then some magic solved the CPU problem for those instances.

It is also quite convenient for checking the results of new instance caging settings…

The resulting CPU will not necessarily be 100%: the SYS CPU time is not included, as well as the user CPU of all the other processes that are either not DB or not monitored with Enterprise Manager.

HTH

Ludovico

Loading resolved Adaptive Plans in the SQL Plan Management

In my previous post, I have shown that loading Adaptive Plans in the SQL Plan Baseline leads to using the original plan. Well, actually, this is true when you capture them via the OPTIMIZER_CAPTURE_SQL_PLAN_BASELINES parameter.

Thanks to a tweet by Neil Chandler, I’ve realized that it was a good idea to show also the case when the plan is loaded manually.

When the adaptive plan switches to the alternative plan, the plan_hash_value also changes, and can be loaded manually in the baseline with DBMS_SPM.

Let’s reset everything and retry quickly to:

  • Capture the plan automatically (this will lead to the original plan)
  • Load the plan manually (I will specify to load the alternative plan, if resolved)
  • Drop the plan captured automatically
  • Use the newly accepted baseline

To recap:

  • The capture process will always load the original plan
  • It is possible to decide to load manually the original one or the alternative one (if resolved)
  • Using automatic capture is a bad idea

HTH

Ludo

How Adaptive Plans work with SQL Plan Baselines?

Disclaimer: after writing this post (but before publishing it) I have seen that other people already blogged about it, so I am ashamed of publishing it anyway… but that’s blogger’s life 🙂

Wednesday I have got a nice question after my presentation about Adaptive Features at the DOAG16 conference:

What happens when you load an adaptive plan in a SQL Plan Baseline?
Does it load only the final plan or does it load the whole plan including the inactive operations? Will the plan be evaluated again using the inflection point?

I have decided to do some tests in order to give the best possible answer. I did not spend the time to rethink about producing an adaptive plan. Tim Hall already did an excellent test case to create and alter an adaptive plan in his blog, so I have reused massively most of its code. Thanks Tim :-).

I will not post all the code (please find it in Tim’s post), I will go straight to the plans.

First: I have an adaptive plan that resolves to NESTED LOOPS:

Second: I load the plan (lazy way: using baseline capture at session level)

Third: re-run the statement and check the plan

It does not look adaptive, but I can also check from the function DBMS_XPLAN.DISPLAY_SQL_PLAN_BASELINE:

Again, despite in the Note section it says it is adaptive, it does not look like an adaptive plan.

Can I trust this information? Of course I did not and tried to check the plan with and without baseline after changing the rows to force a plan switch to HJ (again taking Tim’s example):

After changing the rows:

  • when I do not use the baseline, the plan resolves to HASH JOIN
  • when I use it, the baseline forces to NESTED LOOPS.

So the plan in the baseline is not adaptive and it forces to what has been loaded. Is it the final plan or the original one? I have to capture it again to see if a new baseline appears:

A new baseline does not appear, so it looks that the original plan is considered by the capture process and not the resolved one! To be 100% sure, let’s try to drop the existing one and redo the test:

So, despite the fact that I have an adaptive plan that switches from NL to HJ, only the NESTED LOOPS operations are captured in the baseline, I can infer the only the original plan is loaded as SQL Plan Baseline.

References:

How to fix CPU usage problem in 12c due to DBMS_FEATURE_AWR

I love my job because I always have suprises. This week’s surprise has been another problem related to SQL Plan Directives in 12c. Because it is a common problem that potentially affects ALL the customers, I am glad to share the solution on my blog 😀

Symptom of the problem: High CPU usage on the server

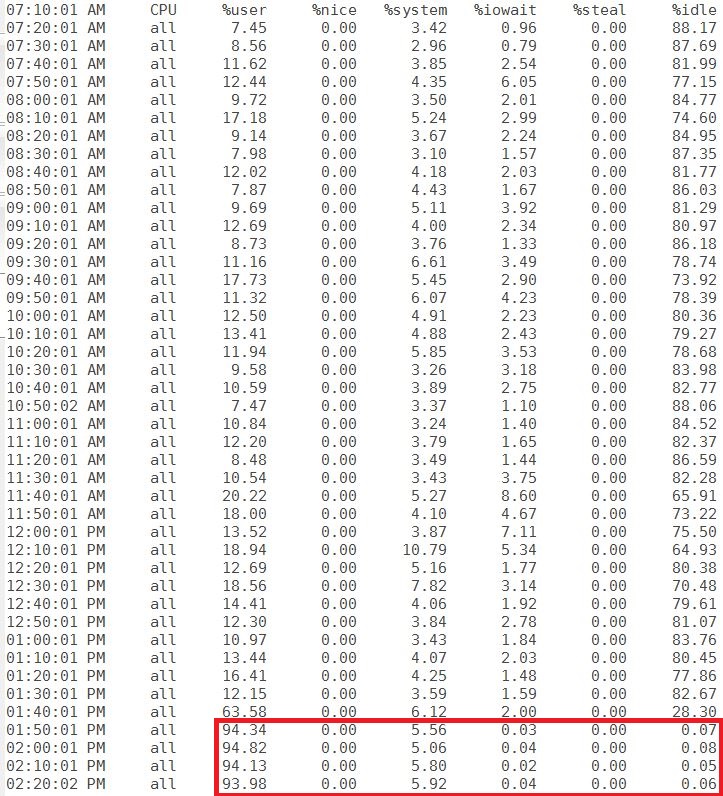
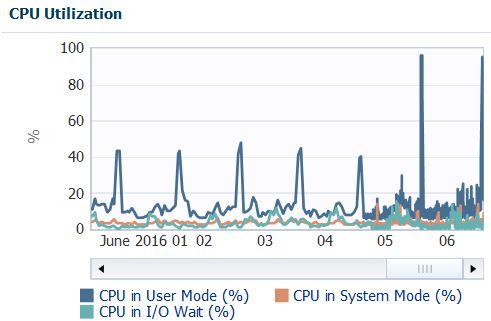
My customer’s DBA team has spotted a consistent high CPU utilisation on its servers:

spd_awr_high_cpu_sar

Everyday, at the same time, and for 20-40 minutes, the servers hosting the Oracle databases run literally out of CPU.

spd_awr_high_cpu_em


Troubleshooting

Ok, it would be too easy to give the solution now. If you cannot wait, jump at the end of this post. But what I like more is to explain how I came to it.

First, I gave a look at the processes consuming CPU. Most of the servers have many consolidated databases on them. Surprisingly, this is what I have found:

spd_awr_high_cpu_m001It seems that the source of the problem is not a single database, but all of them. Isn’t it? And I see another pattern here: the CPU usage comes always from the [m001] process, so it is not related to a user process.

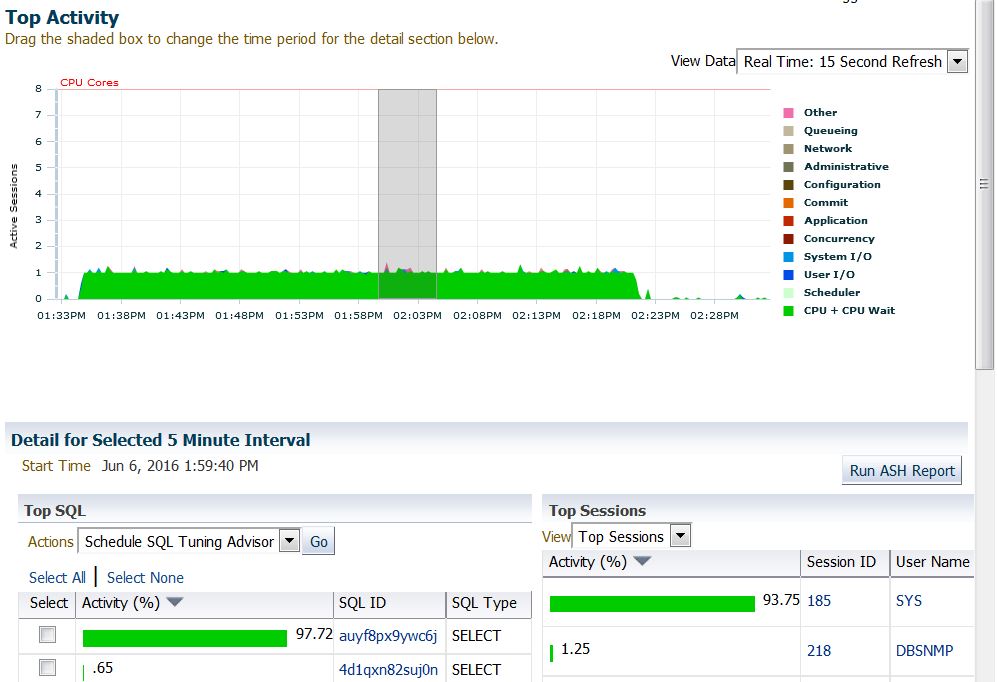
My customer has Diagnostic Pack so it is easy to go deeper, but you can get the same result with other free tools like s-ash, statspack and snapper. However, this is what I have found in the Instance Top Activity:

spd_awr_high_cpu_instOk, everything comes from a single query with sql_id auyf8px9ywc6j. This is the full sql_text:

It looks like something made by a DBA, but it comes from the MMON.

Looking around, it seems closely related to two PL/SQL calls that I could find in the SQL Monitor and that systematically fail every day:

spd_cpu_sql_monitorDBMS_FEATURE_AWR function calls internally the SQL auyf8px9ywc6j.

The MOS does not know anything about that query, but the internet does:

spd_awr_franckOh no, not Franck again! He always discovers new stuff and blogs about it before I do 🙂

In his blog post, he points out that the query fails because of error ORA-12751 (resource plan limiting CPU usage) and that  it is a problem of Adaptive Dynamic Sampling. Is it true?

What I like to do when I have a problematic sql_id, is to run sqld360 from Mauro Pagano, but the resulting zip file does not contain anything useful, because actually there are no executions and no plans.

During the execution of the statement (or better, during the period with high CPU usage), there is an entry in v$sql, but no plans associated:

And this is very likely because the statement is still parsing, and all the time is due to the Dynamic Sampling. But because the plan is not there yet, I cannot check it in the DBMS_XPLAN.DISPLAY_CURSOR.

I decided then to trace it with those two statements:

At the next execution I see indeed the Adaptive Dynamic Sampling in the trace file, the errror due to the exhausted CPU in the resource plan, and the directives that caused the Adaptive Dynamic Sampling:


So, there are some SQL Plan Directives that force the CBO to run ADS for this query.

This query touches three tables, so instead of relying on the DIRECTIVE_IDs, it’s better to get the directives by object name:

Solution

At this point, the solution is the same already pointed out in one of my previous blog posts: disable the directives individually!

This very same PL/SQL block must be run on ALL the 12c databases affected by this Adaptive Dynamic Sampling problem on the sql_id auyf8px9ywc6j.

If you have just migrated the database to 12c, it would make even more sense to programmatically “inject” the disabled SQL Plan Directives into every freshly created or upgraded 12c database (until Oracle releases a patch for this non-bug).

It comes without saying that the next execution has been very quick, consuming almost no CPU and without using ADS.

HTH

Ludovico


Get information about Cursor Sharing for a SQL_ID

Yesterday I’ve got a weird problem with Adaptive Cursor Sharing. I’m not sure yet about the issue, but it seems to be related to cursor sharing histograms. Hopefully one day I will blog about what I’ve learnt from this experience.

To better monitor the problem on that specific query, I’ve prepared this script (tested on 12.1.0.2):

The result is something similar (in my case it has 26 child cursors):

It’s a quick way to get the relevant information in a single result.

Off course, if you need deeper details, you should consider something more powerful like SQLd360 from Mauro Pagano.

Credits: I’ve got the unpivot idea (and copied that part of the code) from this post by Timur Akhmadeev.

Ludo

Querying the dba_hist_sys_time_model to get historical data

This quick post is mainly for myself… I will certainly use it for reference in the future.

Debugging problems due to adaptive dynamic sampling and in general adaptive features sometimes needs to get historical data about, e.g., parse time.

In order to get this information you may need to query the view DBA_HIST_SYS_TIME_MODEL (take care, it needs Diagnostic Pack license!)

You can use this query as an example.


In this specific example, it shows the “parse time elapsed”, the “DB time” and the percentage parse/dbtime, along with the value of the parameter “optimizer_adaptive_features“. You can use it to check if changing the parameters related to adaptive dynamic sampling improves or not the parse time.

The output will be something like this:

HTH

Ludo

SQL Plan Directives: they’re always good… except when they’re bad!

The new Oracle 12c optimizer adaptive features are just great and work well out of the box in most cases.

Recently, however,  I’ve experienced my very first problem with SQL Plan Directives migrating a database to 12c, so I would like to share it.

Disclaimer 1: this is a specific problem that I found on ONE system. My solution may not fit with your environment, don’t use it if you are not sure about what you’re doing!

Disclaimer 2: despite I had this problem with a single SPD, I like adaptive features and I encourage to use them!!

Problem: a query takes a sub-second in 11gR2, in 12c it takes 12 seconds or more.

V_TAB_PROP is a very simple view. It just selects a central table “TAB” and then takes different properties by joining  a property table “TAB_PROP”.

To do that, it does 11 joins on the same property table.

On the property table, TAB_PROP_ID and PROP_ID are unique (they compose the pk), so nested loops and index unique scans are the best way to get this data.
The table is 1500Mb big and the index 1000Mb.

This was the plan in 11g:

In 12c, the plan switches to adaptive, and half of the joins are converted to hash joins / full table scans:

However, the inflection point is never reached. The execution keeps the default plan that has half of the joins HJ and the other half NL.

The problem in this case is the SQL Directive. Why?

There are to many distinct values for TAB_ID and the data is very skewed.

The histogram on that column is OK and it always leads to the correct plan (with the adaptive features disabled).
But there are still some “minor” misestimates, and the optimizer sometimes decides to create a SQL Plan directive:

The Directive instructs the optimizer to do a dynamic sampling, but with a such big and skewed table this is not ok, so the Dynamic sampling result is worse than using the histogram. I can check it by simplifying the query to just one join:

What’s the fix?

I’ve tried to drop the directive first, but it reappears as soon as there are new misestimates.
The best solution in my case has been to disable the directive, an operation that can be done easily with the DBMS_SPD package:

I did this on a QAS environment.
Because the production system is not migrated to 12c yet, it’s wise to import these disabled directives in production before the optimizer creates and enables them.

Off course, the directives can’t be created for objects that do not exist, the import  has to be done after the objects migrate to the 12c version.

Because the SQL Plan Directives are tied to specific objects and not specific queries, they can fix many statements at once, but in case like this one, they can compromise several statements!

Monitoring the creation of new directives is an important task as it may indicate misestimates/lack of statistics on one side or execution plan changes on the other one.

In-memory Columnar Store hands-on

As I’ve written in my previous post, the inmemory_size parameter is static, so you need to restart your instance to activate it or change its size. Let’s try to set it at 600M.


First interesting thing: it has been rounded to 608M so it works in chunks of 16M. (to be verified)

Which views can you select for further information?

V$IM_SEGMENTS gives a few information about the segments that have a columnar version, including the segment size, the actual memory allocated, the population status and other compression indicators.

The other views help understand the various memory chunks and the status for each column in the segment.

Let’s create a table with a few records:

The table is very simple, it’s a cartesian of two “all_tables” views.

Let’s also create an index on it:

The table uses 621M and the index 192M.

How long does it take to do a full table scan almost from disk?

15 seconds! Ok, I’m this virtual machine is on an external drive 5400  RPM… 🙁

Once the table is fully cached in the buffer cache, the query performance progressively improves to ~1 sec.

There is no inmemory segment yet:

You have to specify it at table level:

The actual creation of the columnar store takes a while, especially if you don’t specify to create it with high priority. You may have to query the table before seeing the columnar store and its population will also take some time and increase the overall load of the database (on my VBox VM, the performance overhead of columnar store population is NOT negligible).

Once the in-memory store created, the optimizer is ready to use it:

The previous query now takes half the time on the first attempt!

The columnar store for the whole table uses 23M out of 621M, so the compression ratio is very good compared to the non-compressed index previously created!


This is a very short example. The result here (2x improvement) is influenced by several factors. It is safe to think that with “normal” production conditions the gain will be much higher in almost all the cases.
I just wanted to demonstrate that in-memory columnar store is space efficient and really provides higher speed out of the box.

Now that you know  about it, can you live without? 😛

Oracle Database 12c in-memory option, a quick overview

Oracle Database 12.1.0.2 is finally out, and as we all knew in advance, it contains the new in-memory option.

I think that, despite its cost ($23k per processor), this is another great improvement! 🙂

Consistent savings!

This new feature is not to be confused with Times Ten. In-memory is a feature that enable a new memory area inside the SGA that is used to contain a columnar organized copy of segments entirely in memory. Columnar stores organize the data as columns instead of rows and they are ideal for queries that involve a few columns on many rows, e.g. for analytic reports, but they work great also for all extemporary queries that cannot make use of existing indexes.

Columnar stores don’t replace traditional indexes for data integrity or fast single-row look-ups,  but they can replace many additional indexes created for the solely purpose of reporting. Hence, if from one side it seems a waste of memory, on the other side using in-memory can lead to consistent memory savings due to all the indexes that have no more reason to exist.

Let’s take an example of a table (in RED) with nine indexes (other colors).

inmem_table_indexes

If you try to imagine all the blocks in the buffer cache, you may think about something like this:

inmem_sga1

Now, with the in-memory columnar store, you can get the rid of many indexes because they’ve been created just for reporting and they are now superseded by the performance of the new feature:

inmem_no_indexes


In this case, you’re not only saving blocks on disk, but also in the buffer cache, making room for the in-memory area. With columnar store, the compression factor may allow to easily fit your entire table in the same space that was previously required for a few, query-specific indexes. So you’ll have the buffer cache with traditional row-organized blocks (red, yellow, light and dark blue) and the separate in-memory area with a columnar copy of the segment (gray).

inmem_sga2

The in-memory store doesn’t make use of undo segments and redo buffer, so you’re also saving undo block buffers and physical I/O!


The added value

In my opinion this option will have much more attention from the customers than Multitenant for a very simple reason.

How many customers (in percentage)  would pay to achieve better consolidation of hundreds of databases? A few.

How many  would pay or are already paying for having better performance for critical applications? Almost all the customers I know!


Internal mechanisms

In-memory is enabled on a per-segment basis: you can specify a table or a partition to be stored in-memory.

Each column is organized in separate chunks of memory called In Memory Compression Units (IMCU). The number of IMCUs required for each column may vary.

Each IMCU contains the data of the column and a journal used to guarantee read consistency with the blocks in the buffer cache. The data is not modified on the fly in the IMCU, but the row it refers to is marked as stale in a journal that is stored inside the IMCU itself. When the stale data grows above a certain threshold the space efficiency of the columnar store decreases and the in-memory coordinator process ([imco]) may force a re-population of the store.
Re-population may also occur after manual intervention or at the instance startup: because it is memory-only, the data actually need to be populated in the in-memory store from disk.

Whether the data is populated immediately after the startup or not, it actually depends on the priority specified for the specific segment. The higher the priority, the sooner the segment will be populated in-memory. The priority attribute also drives which segments would survive in-memory in case of “in-memory pressure”. Sadly, the parameter inmemory_size that specifies the size of the in-memory area is static and an instance restart is required in order to change it, that’s why you need to plan carefully the size prior to its activation. There is a compression advisor for in-memory that can help out on this.

Conclusion

In this post you’ve seen a small introduction about in-memory. I hope I can publish very soon another post with a few practical examples.