I love my job because I always have suprises. This week’s surprise has been another problem related to SQL Plan Directives in 12c. Because it is a common problem that potentially affects ALL the customers, I am glad to share the solution on my blog 😀
Symptom of the problem: High CPU usage on the server
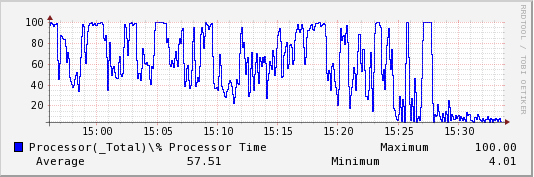
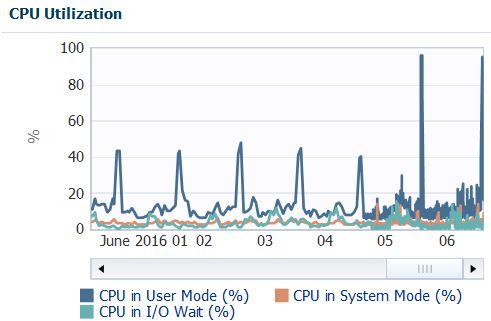
My customer’s DBA team has spotted a consistent high CPU utilisation on its servers:
Everyday, at the same time, and for 20-40 minutes, the servers hosting the Oracle databases run literally out of CPU.
Troubleshooting
Ok, it would be too easy to give the solution now. If you cannot wait, jump at the end of this post. But what I like more is to explain how I came to it.
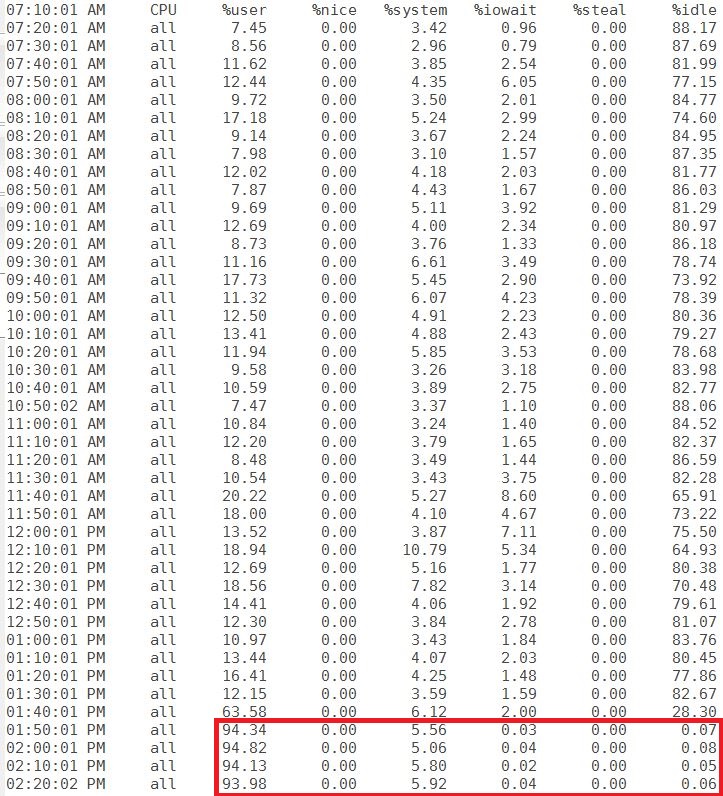
First, I gave a look at the processes consuming CPU. Most of the servers have many consolidated databases on them. Surprisingly, this is what I have found:
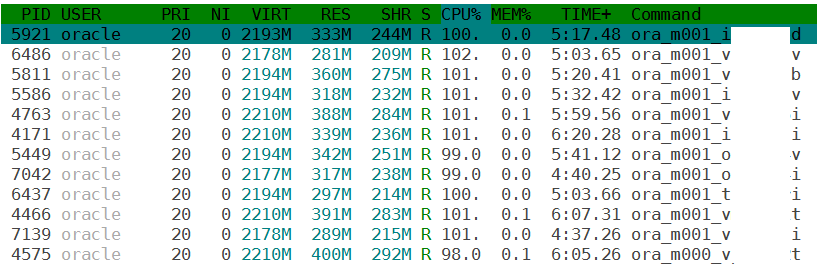 It seems that the source of the problem is not a single database, but all of them. Isn’t it? And I see another pattern here: the CPU usage comes always from the [m001] process, so it is not related to a user process.
My customer has Diagnostic Pack so it is easy to go deeper, but you can get the same result with other free tools like s-ash, statspack and snapper. However, this is what I have found in the Instance Top Activity:
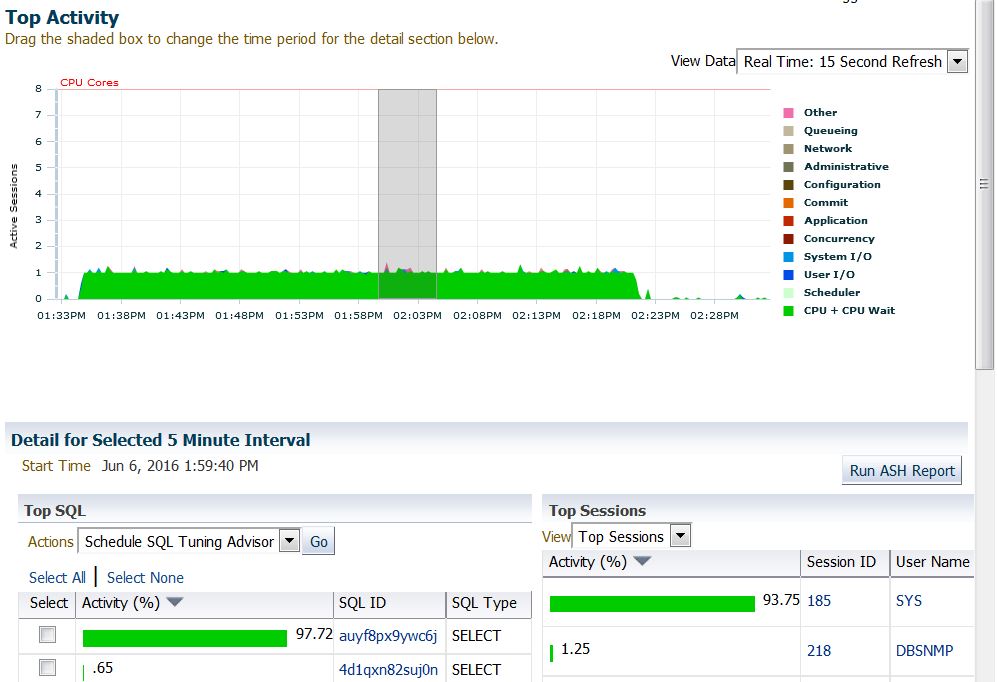 Ok, everything comes from a single query with sql_id auyf8px9ywc6j. This is the full sql_text:
|
1 2 3 4 5 6 7 8 |
(SELECT /*+ FULL(ST) */ SN.DBID ,SN.INSTANCE_NUMBER ,SN.STARTUP_TIME ,ST.STAT_ID ,ST.STAT_NAME ,MIN(SN.SNAP_ID) AS MIN_SNAP ,MAX(SN.SNAP_ID) AS MAX_SNAP ,MIN(CAST(BEGIN_INTERVAL_TIME AS DATE)) AS MIN_DATE ,MAX(CAST(END_INTERVAL_TIME AS DATE)) AS MAX_DATE FROM DBA_HIST_SNAPSHOT SN ,WRH$_STAT_NAME ST WHERE SN.BEGIN_INTERVAL_TIME > TRUNC(SYSDATE) - 7 AND SN.END_INTERVAL_TIME < TRUNC(SYSDATE) AND SN.DBID = ST.DBID AND ST.STAT_NAME IN ('DB time', 'DB CPU') GROUP BY SN.DBID,SN.INSTANCE_NUMBER,SN.STARTUP_TIME,ST.STAT_ID,ST.STAT_NAME ) ,DELTA_DATA AS (SELECT SR.DBID ,SR.INSTANCE_NUMBER ,SR.STAT_NAME ,CASE WHEN SR.STARTUP_TIME BETWEEN SR.MIN_DATE AND SR.MAX_DATE THEN TM1.VALUE + (TM2.VALUE - TM1.VALUE) ELSE (TM2.VALUE - TM1.VALUE) END AS DELTA_TIME FROM WRH$_SYS_TIME_MODEL TM1 ,WRH$_SYS_TIME_MODEL TM2 ,SNAP_RANGES SR WHERE TM1.DBID = SR.DBID AND TM1.INSTANCE_NUMBER = SR.INSTANCE_NUMBER AND TM1.SNAP_ID = SR.MIN_SNAP AND TM1.STAT_ID = SR.STAT_ID AND TM2.DBID = SR.DBID AND TM2.INSTANCE_NUMBER = SR.INSTANCE_NUMBER AND TM2.SNAP_ID = SR.MAX_SNAP AND TM2.STAT_ID = SR.STAT_ID ) SELECT STAT_NAME ,ROUND(SUM(DELTA_TIME/1000000),2) AS SECS FROM DELTA_DATA GROUP BY STAT_NAME |
It looks like something made by a DBA, but it comes from the MMON.
Looking around, it seems closely related to two PL/SQL calls that I could find in the SQL Monitor and that systematically fail every day:
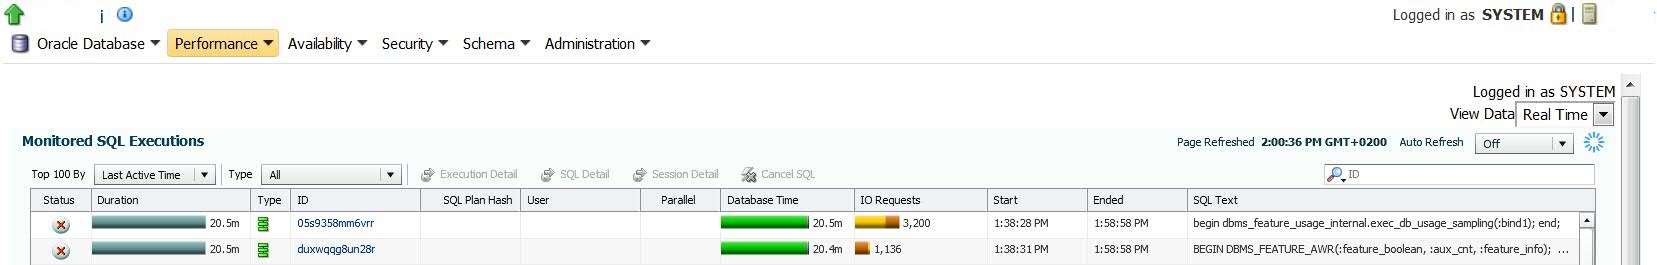 DBMS_FEATURE_AWR function calls internally the SQL auyf8px9ywc6j.
The MOS does not know anything about that query, but the internet does:
 Oh no, not Franck again! He always discovers new stuff and blogs about it before I do 🙂
In his blog post, he points out that the query fails because of error ORA-12751 (resource plan limiting CPU usage) and that it is a problem of Adaptive Dynamic Sampling. Is it true?
What I like to do when I have a problematic sql_id, is to run sqld360 from Mauro Pagano, but the resulting zip file does not contain anything useful, because actually there are no executions and no plans.
|
1 2 3 4 5 6 7 8 9 10 11 |
SQL> select sql_id, executions, loads, cpu_time from v$sqlstats where sql_id='auyf8px9ywc6j'; SQL_ID EXECUTIONS LOADS CPU_TIME ------------- ---------- ---------- ---------- auyf8px9ywc6j 0 11 0 SQL> select sql_id, child_number from v$sql where sql_id='auyf8px9ywc6j'; no rows selected SQL> |
During the execution of the statement (or better, during the period with high CPU usage), there is an entry in v$sql, but no plans associated:
|
1 2 3 4 5 6 7 8 9 10 11 12 13 14 15 16 17 18 19 20 21 22 23 24 25 26 27 28 29 30 31 32 33 34 |
SQL> select sql_id, child_number from v$sql where sql_id='auyf8px9ywc6j'; SQL_ID CHILD_NUMBER ------------- ------------ auyf8px9ywc6j 0 SQL> select * from table (dbms_xplan.display_cursor('auyf8px9ywc6j',0, 'ALL +NOTE')); PLAN_TABLE_OUTPUT ------------------------------------------------------------------------------------------------------------------------------------------------------------------------------------ SQL_ID auyf8px9ywc6j, child number 0 WITH SNAP_RANGES AS (SELECT /*+ FULL(ST) */ SN.DBID ,SN.INSTANCE_NUMBER ,SN.STARTUP_TIME ,ST.STAT_ID ,ST.STAT_NAME ,MIN(SN.SNAP_ID) AS MIN_SNAP ,MAX(SN.SNAP_ID) AS MAX_SNAP ,MIN(CAST(BEGIN_INTERVAL_TIME AS DATE)) AS MIN_DATE ,MAX(CAST(END_INTERVAL_TIME AS DATE)) AS MAX_DATE FROM DBA_HIST_SNAPSHOT SN ,WRH$_STAT_NAME ST WHERE SN.BEGIN_INTERVAL_TIME > TRUNC(SYSDATE) - 7 AND SN.END_INTERVAL_TIME < TRUNC(SYSDATE) AND SN.DBID = ST.DBID AND ST.STAT_NAME IN ('DB time', 'DB CPU') GROUP BY SN.DBID,SN.INSTANCE_NUMBER,SN.STARTUP_TIME,ST.STAT_ID,ST.STAT_NAME ) ,DELTA_DATA AS (SELECT SR.DBID ,SR.INSTANCE_NUMBER ,SR.STAT_NAME ,CASE WHEN SR.STARTUP_TIME BETWEEN SR.MIN_DATE AND SR.MAX_DATE THEN TM1.VALUE + (TM2.VALUE - TM1.VALUE) ELSE (TM2.VALUE - TM1.VALUE) END AS DELTA_TIME FROM WRH$_SYS_TIME_MODEL TM1 ,WRH$_SYS_TIME_MODEL TM2 ,SNAP_RANGES SR WHERE TM1.DBID = SR.DBID AND TM1.INSTANCE_NUMBER = SR.INSTANCE_NUMBER AND TM1.SNAP_ID = SR.MIN_SNAP AND TM1.STAT_ID = SR.STAT_ID AND TM2.DBID = SR.DBID AND TM2. NOTE: cannot fetch plan for SQL_ID: auyf8px9ywc6j, CHILD_NUMBER: 0 Please verify value of SQL_ID and CHILD_NUMBER; It could also be that the plan is no longer in cursor cache (check v$sql_plan) 22 rows selected. |
And this is very likely because the statement is still parsing, and all the time is due to the Dynamic Sampling. But because the plan is not there yet, I cannot check it in the DBMS_XPLAN.DISPLAY_CURSOR.
I decided then to trace it with those two statements:
|
1 2 3 |
SQL> alter system set events 'sql_trace [sql:auyf8px9ywc6j]'; SQL> alter system set events 'trace[rdbms.SQL_Optimizer.*][sql:auyf8px9ywc6j]'; |
At the next execution I see indeed the Adaptive Dynamic Sampling in the trace file, the errror due to the exhausted CPU in the resource plan, and the directives that caused the Adaptive Dynamic Sampling:
|
1 2 3 4 5 6 7 8 9 10 11 12 13 |
======================================= SPD: BEGIN context at query block level ======================================= Query Block SEL$3877D5D0 (#3) Applicable DS directives: dirid = 17707367266596005344, state = 5, flags = 1, loc = 1 {CJ(8694)[1, 2]} dirid = 17748238338555778238, state = 5, flags = 1, loc = 4 {(8694)[2, 3, 4]; (8460)[2, 3]} dirid = 10027833930063681981, state = 1, flags = 5, loc = 4 {(8694)[2, 3, 4]; (8460)[2, 3]; (8436)[1, 5]; (8436)[1, 5]} Checking valid directives for the query block SPD: Directive valid: dirid = 17748238338555778238, state = 5, flags = 1, loc = 4 {(8694)[2, 3, 4]; (8460)[2, 3]} SPD: Return code in qosdDSDirSetup: EXISTS, estType = GROUP_BY SPD: Return code in qosdDSDirSetup: NODIR, estType = HAVING SPD: Return code in qosdDSDirSetup: NODIR, estType = QUERY_BLOCK |
|
1 2 3 4 5 |
PARSING IN CURSOR #139834781881608 len=1106 dep=4 uid=0 oct=3 lid=0 tim=3349661181783 hv=4280474888 ad='95770310' sqlid='8w3h8fvzk5r88' SELECT /* DS_SVC */ /*+ dynamic_sampling(0) no_sql_tune no_monitoring optimizer_features_enable(default) no_parallel result_cache(snapshot=3600) */ SUM(C1) FROM (SELECT /*+ qb_name("innerQuery") */ 1 AS C1 FROM (SELECT /*+ FULL ("ST") */ "WRM$_SNAPSHOT"."DBID" "DBID","WRM$_SNAPSHOT"."INSTANCE_NUMBER" "INSTANCE_NUMBER","WRM$_SNAPSHOT"."STARTUP_TIME" "STARTUP_TIME","ST"."STAT_ID" "STAT_ID","ST"."STAT_NAME" "STAT_NAME",MIN("WRM$_SNAPSHOT"."SNAP_ID") "MIN_SNAP",MAX("WRM$_SNAPSHOT"."SNAP_ID") "MAX_SNAP",MIN(CAST("WRM$_SNAPSHOT"."BEGIN_INTERVAL_TIME" AS DATE)) "MIN_DATE",MAX(CAST("WRM$_SNAPSHOT"."END_INTERVAL_TIME" AS DATE)) "MAX_DATE" FROM SYS."WRM$_SNAPSHOT" "WRM$_SNAPSHOT","WRH$_STAT_NAME" "ST" WHERE "WRM$_SNAPSHOT"."DBID"="ST"."DBID" AND ("ST"."STAT_NAME"='DB CPU' OR "ST"."STAT_NAME"='DB time') AND "WRM$_SNAPSHOT"."STATUS"=0 AND "WRM$_SNAPSHOT"."BEGIN_INTERVAL_TIME">TRUNC(SYSDATE@!)-7 AND "WRM$_SNAPSHOT"."END_INTERVAL_TIME"<TRUNC(SYSDATE@!) GROUP BY "WRM$_SNAPSHOT"."DBID","WRM$_SNAPSHOT"."INSTANCE_NUMBER","WRM$_SNAPSHOT"."STARTUP_TIME","ST"."STAT_ID","ST"."STAT_NAME") "VW_DIS_1") innerQuery END OF STMT ... >> Query Blk Card adjusted from 3.000000 to 2.000000 due to adaptive dynamic sampling |
|
1 2 3 4 5 6 7 8 9 10 11 |
*** KEWUXS - encountered error: (ORA-12751: violation du temps UC ou des règles relatives au temps d'exécution ORA-06512: à "SYS.DBMS_FEATURE_AWR", ligne 14 ORA-06512: à "SYS.DBMS_FEATURE_AWR", ligne 92 ORA-06512: à ligne 1 ORA-06512: à "SYS.DBMS_SQL", ligne 1707 ORA-06512: à "SYS.DBMS_FEATURE_USAGE_INTERNAL", ligne 312 ORA-06512: à "SYS.DBMS_FEATURE_USAGE_INTERNAL", ligne 522 ORA-06512: à "SYS.DBMS_FEATURE_USAGE_INTERNAL", ligne 694 ORA-06512: à "SYS.DBMS_FEATURE_USAGE_INTERNAL", ligne 791 ORA-06512: à ligne 1 ) |
So, there are some SQL Plan Directives that force the CBO to run ADS for this query.
|
1 2 3 4 5 6 7 8 9 10 11 12 13 14 |
SQL> select TYPE, ENABLED, STATE, AUTO_DROP, REASON, CREATED, LAST_MODIFIED, LAST_USED from dba_sql_plan_directives where directive_id in (10027833930063681981, 17707367266596005344, 17748238338555778238); TYPE ENA STATE AUT REASON CREATED ---------------- --- ---------- --- ------------------------------------ --------------------------------------------------------------------------- LAST_MODIFIED LAST_USED --------------------------------------------------------------------------- --------------------------------------------------------------------------- DYNAMIC_SAMPLING YES USABLE YES GROUP BY CARDINALITY MISESTIMATE 03-JUN-16 02.10.41.000000 PM 03-JUN-16 04.14.32.000000 PM DYNAMIC_SAMPLING YES USABLE YES SINGLE TABLE CARDINALITY MISESTIMATE 27-MAR-16 09.01.20.000000 AM 17-APR-16 09.13.01.000000 AM 17-APR-16 09.13.01.000000000 AM DYNAMIC_SAMPLING YES USABLE YES GROUP BY CARDINALITY MISESTIMATE 13-FEB-16 06.07.36.000000 AM 27-FEB-16 06.03.09.000000 AM 03-JUN-16 02.10.41.000000000 PM |
This query touches three tables, so instead of relying on the DIRECTIVE_IDs, it’s better to get the directives by object name:
|
1 2 3 4 5 6 7 8 9 10 11 12 13 14 15 16 17 18 19 20 |
SQL> r 1 select distinct d.directive_id, TYPE, ENABLED, STATE, AUTO_DROP, REASON, CREATED, LAST_MODIFIED 2 from dba_sql_plan_directives d join dba_sql_plan_dir_objects o on 3* (d.directive_id=o.directive_id) where o.owner='SYS' and o.object_name in ('WRH$_SYS_TIME_MODEL','WRH$_STAT_NAME','WRM$_SNAPSHOT') DIRECTIVE_ID TYPE ENA STATE AUT REASON CREATED ------------ ---------------- --- ---------- --- ------------------------------------ --------------------------------------------------------------------------- LAST_MODIFIED --------------------------------------------------------------------------- 8.8578E+18 DYNAMIC_SAMPLING YES USABLE YES JOIN CARDINALITY MISESTIMATE 14-FEB-16 08.11.29.000000 AM 06-JUN-16 01.57.35.000000 PM 1.7748E+19 DYNAMIC_SAMPLING YES USABLE YES GROUP BY CARDINALITY MISESTIMATE 19-MAR-16 02.15.17.000000 AM 06-JUN-16 01.57.35.000000 PM 1.7170E+19 DYNAMIC_SAMPLING YES USABLE YES JOIN CARDINALITY MISESTIMATE 14-FEB-16 08.11.29.000000 AM 06-JUN-16 01.57.35.000000 PM 1.7707E+19 DYNAMIC_SAMPLING YES USABLE YES SINGLE TABLE CARDINALITY MISESTIMATE 13-MAR-16 08.04.38.000000 AM 06-JUN-16 01.57.35.000000 PM |
Solution
At this point, the solution is the same already pointed out in one of my previous blog posts: disable the directives individually!
|
1 2 3 4 5 6 7 8 9 10 11 |
BEGIN FOR rec in (select d.directive_id as did from dba_sql_plan_directives d join dba_sql_plan_dir_objects o on (d.directive_id=o.directive_id) where o.owner='SYS' and o.object_name in ('WRH$_SYS_TIME_MODEL','WRH$_STAT_NAME','WRM$_SNAPSHOT')) LOOP DBMS_SPD.ALTER_SQL_PLAN_DIRECTIVE ( rec.did, 'ENABLED','NO'); DBMS_SPD.ALTER_SQL_PLAN_DIRECTIVE ( rec.did, 'AUTO_DROP','NO'); END LOOP; END; / |
This very same PL/SQL block must be run on ALL the 12c databases affected by this Adaptive Dynamic Sampling problem on the sql_id auyf8px9ywc6j.
If you have just migrated the database to 12c, it would make even more sense to programmatically “inject” the disabled SQL Plan Directives into every freshly created or upgraded 12c database (until Oracle releases a patch for this non-bug).
|
1 2 3 4 5 6 7 8 9 10 11 12 13 14 15 16 17 18 19 20 21 22 23 24 25 26 27 28 29 30 31 |
-- export from a source where the directives exist and have been disabled SET SERVEROUTPUT ON DECLARE my_list DBMS_SPD.OBJECTTAB := DBMS_SPD.ObjectTab(); dir_cnt NUMBER; BEGIN DBMS_SPD.CREATE_STGTAB_DIRECTIVE (table_name => 'AUYF8PX9YWC6J_DIRECTIVES', table_owner=> 'SYSTEM' ); my_list.extend(3); -- TAB table my_list(1).owner := 'SYS'; my_list(1).object_name := 'WRH$_SYS_TIME_MODEL'; my_list(1).object_type := 'TABLE'; my_list(2).owner := 'SYS'; my_list(2).object_name := 'WRH$_STAT_NAME'; my_list(2).object_type := 'TABLE'; my_list(3).owner := 'SYS'; my_list(3).object_name := 'WRM$_SNAPSHOT'; my_list(3).object_type := 'TABLE'; dir_cnt := DBMS_SPD.PACK_STGTAB_DIRECTIVE(table_name => 'AUYF8PX9YWC6J_DIRECTIVES', table_owner=> 'SYSTEM', obj_list => my_list); DBMS_OUTPUT.PUT_LINE('dir_cnt = ' || dir_cnt); END; / expdp directory=data_pump_dir dumpfile=AUYF8PX9YWC6J_DIRECTIVES.dmp logfile=expdp_AUYF8PX9YWC6J_DIRECTIVES.log tables=system.AUYF8PX9YWC6J_DIRECTIVES -- import into the freshly upgraded/created 12c database impdp directory=data_pump_dir dumpfile=AUYF8PX9YWC6J_DIRECTIVES.dmp logfile=impdp_AUYF8PX9YWC6J_DIRECTIVES.log SELECT DBMS_SPD.UNPACK_STGTAB_DIRECTIVE(table_name => 'AUYF8PX9YWC6J_DIRECTIVES', table_owner=> 'SYSTEM') FROM DUAL; |
It comes without saying that the next execution has been very quick, consuming almost no CPU and without using ADS.
HTH
—
Ludovico