In particular, MEM 3.0 does not have a usable database. In MEM all the tables are crypted and it is not possible to list, for example, all the targets monitored, nor it is possible via API or REST web services because MEM 3.0 lacks these features.
What makes EM12c a GREAT product comparing to MEM, are many features like blackouts, a usable command line interface (emcli), integrated reporting, scheduler, automatic groups… the list would be just huge.
Luckily, Oracle has officially released a MySQL plugin for EM12c, provided that the EM is at least in version 12.1.0.4.
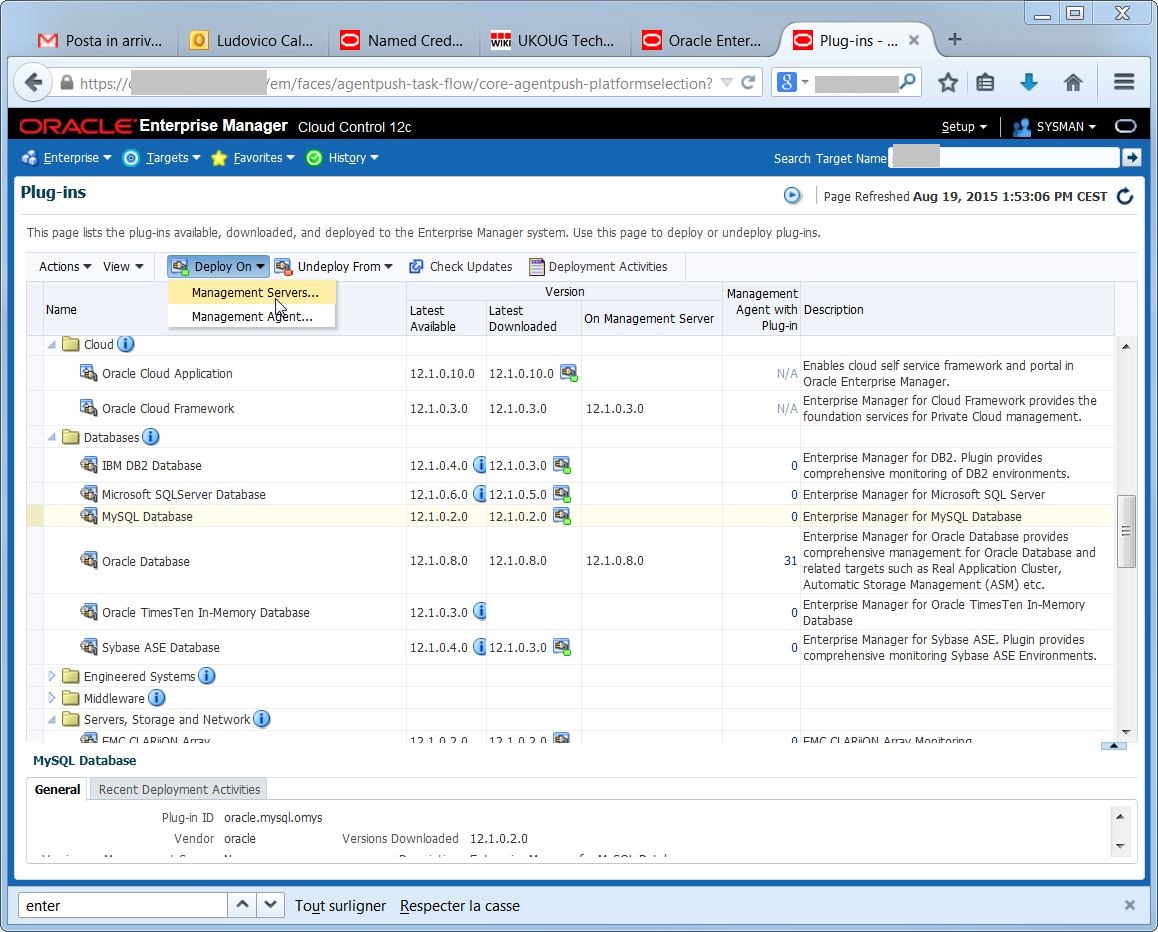
The first step is to download the last version of plugin for MySQL.
I can verify that you have the last version by going to
Setup -> Extensibility -> Self-Update -> Plugins:
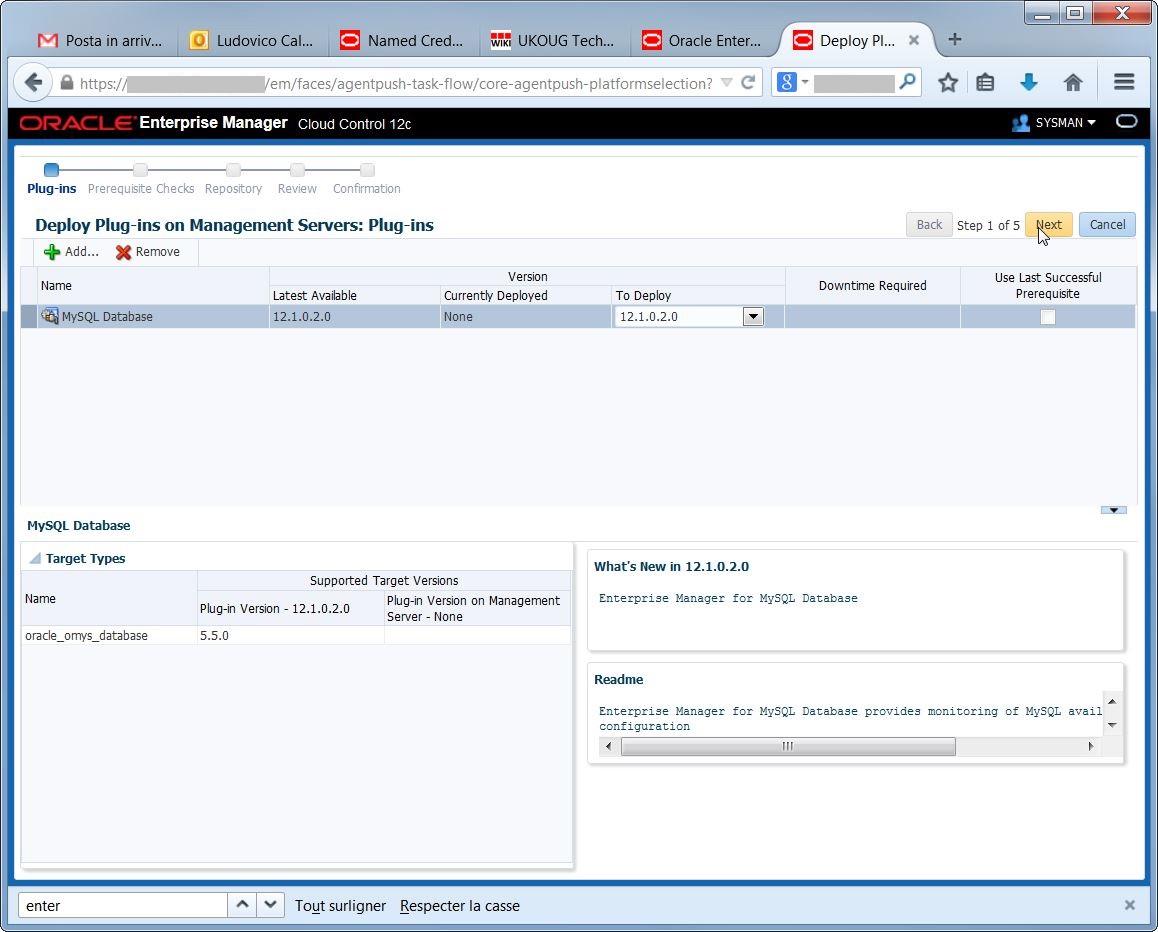
The agent has been downloaded, but in order to make it available on the targets, I first need to deploy it on the management servers (2 OMSes in my case):
Check the plugin name and version:
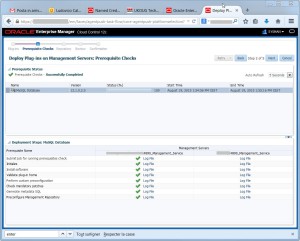
Verify the prerequisites check (here I have one column per OMS):
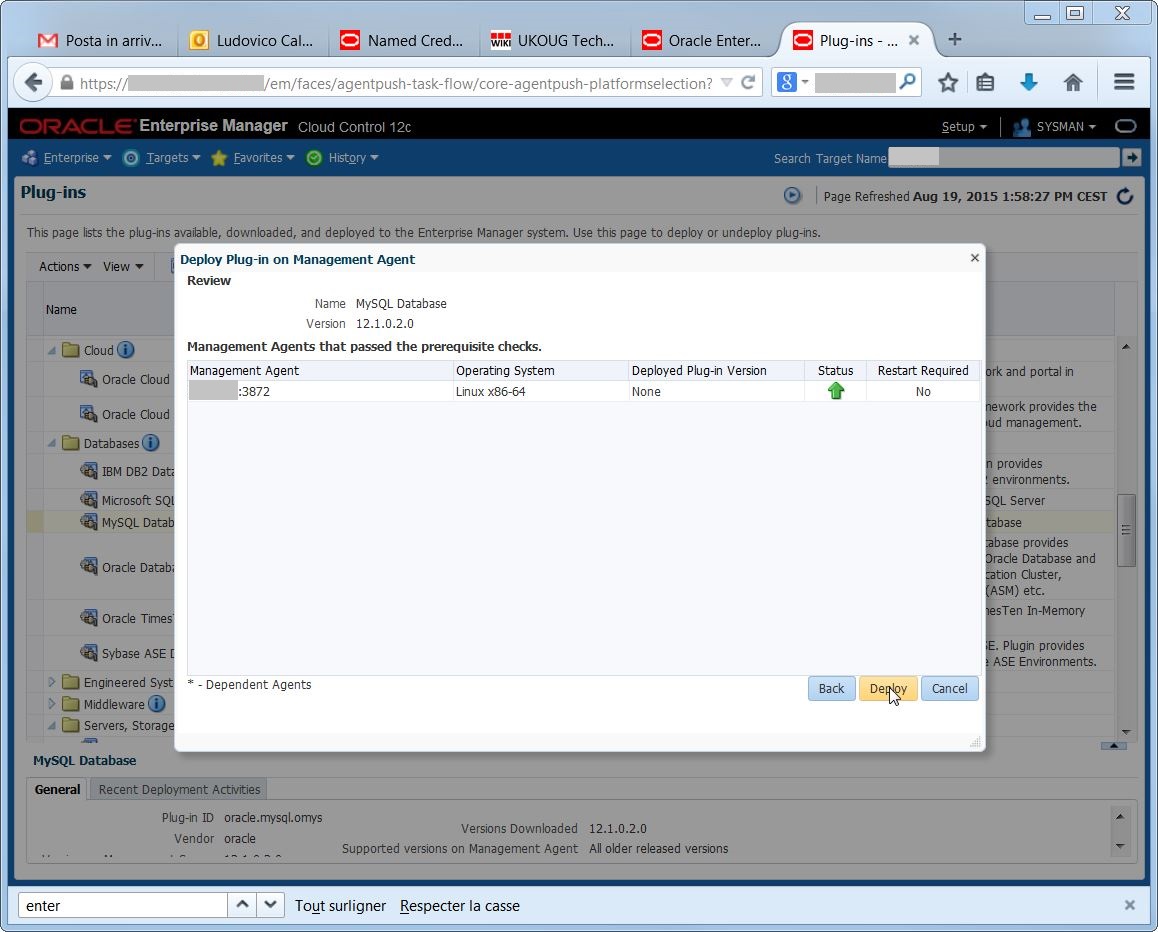
Specify the credentials for the Management Repository: Execute the deploy:
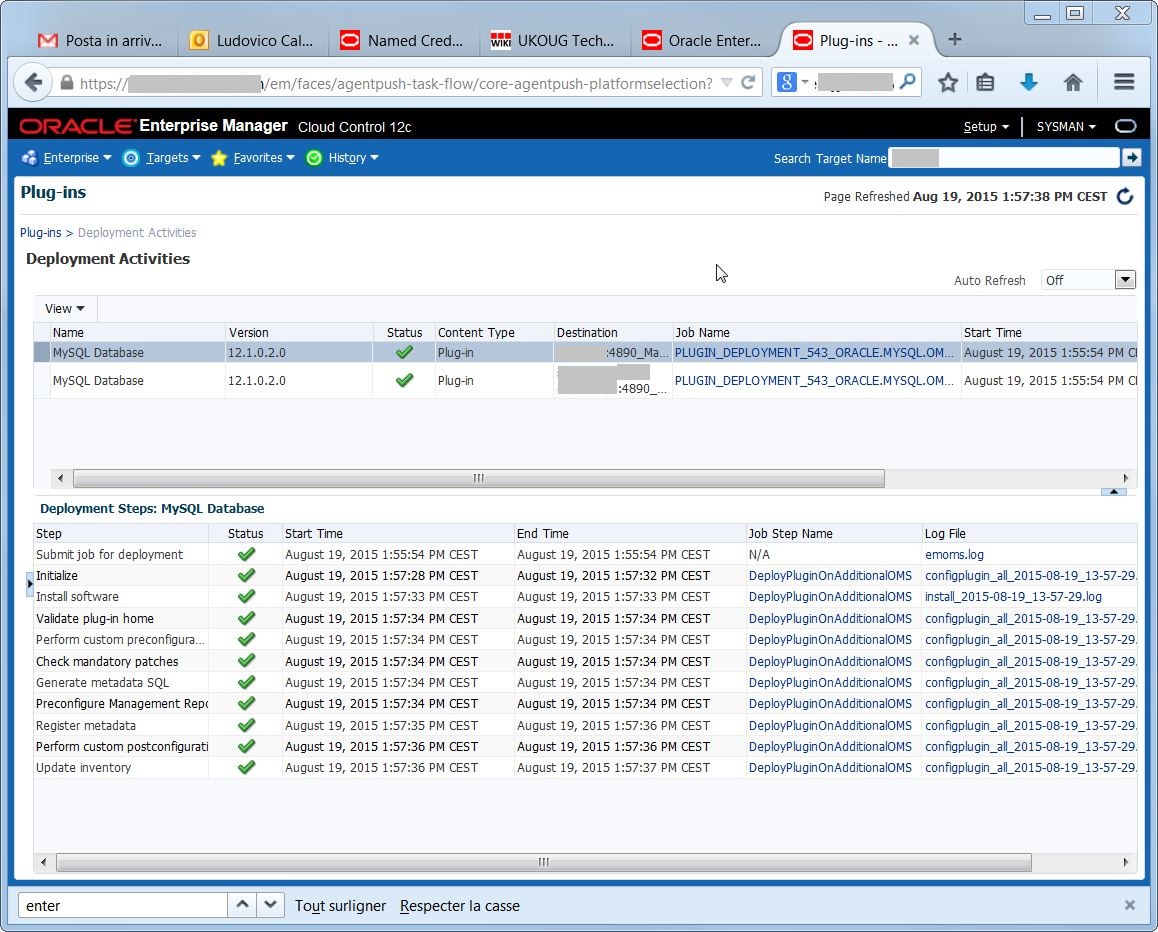
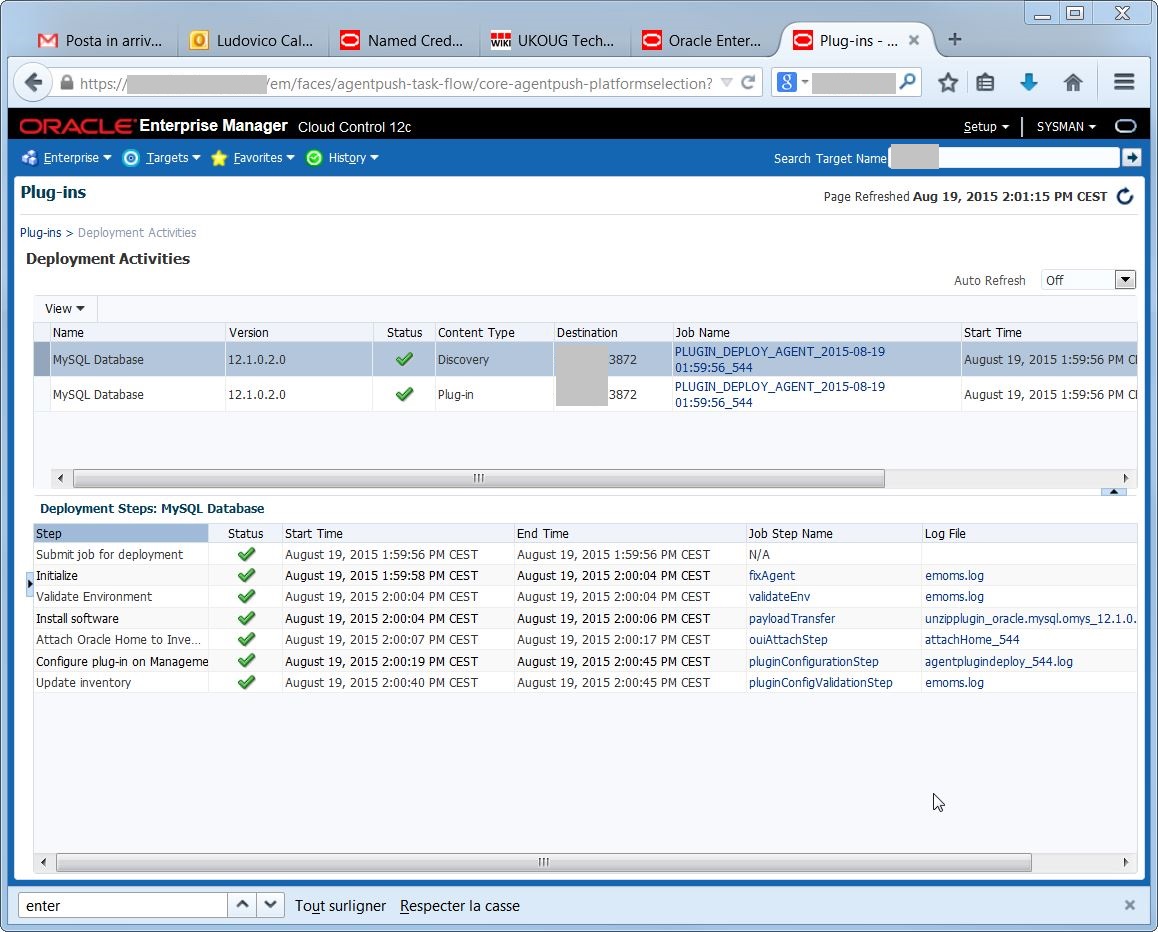
If everything went OK, I’m able to check the status of the deployment:
Now I can see that the plugin is correctly deployed on the OMSes, I can do the same for the agents:
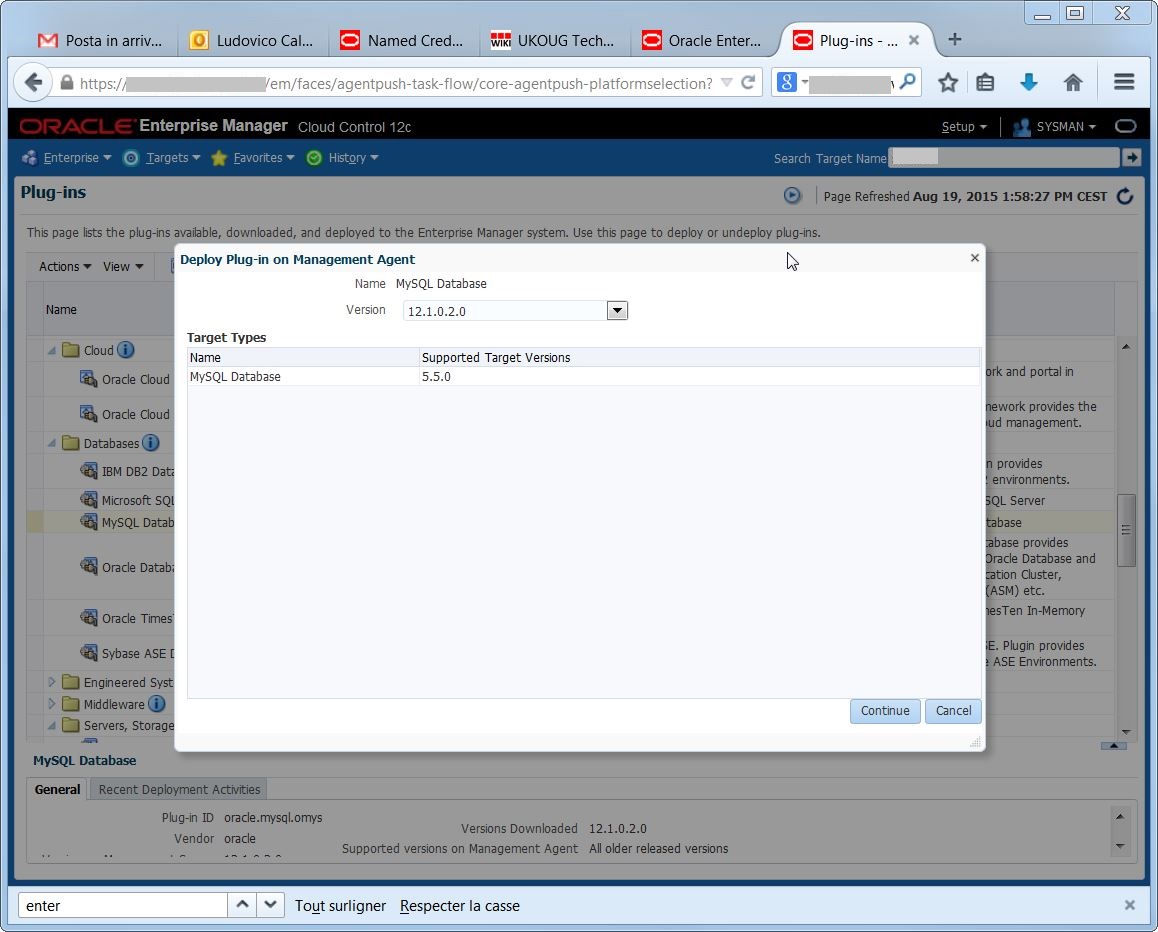
I must select one by one the agents that run on the hosts where I have MySQL running. I may select all agents as well, but it’s better to be neat…
again, there are prerequisite checks and confirmations:
The plugin deployment went well:
Now I can run the target discovery on the agent:
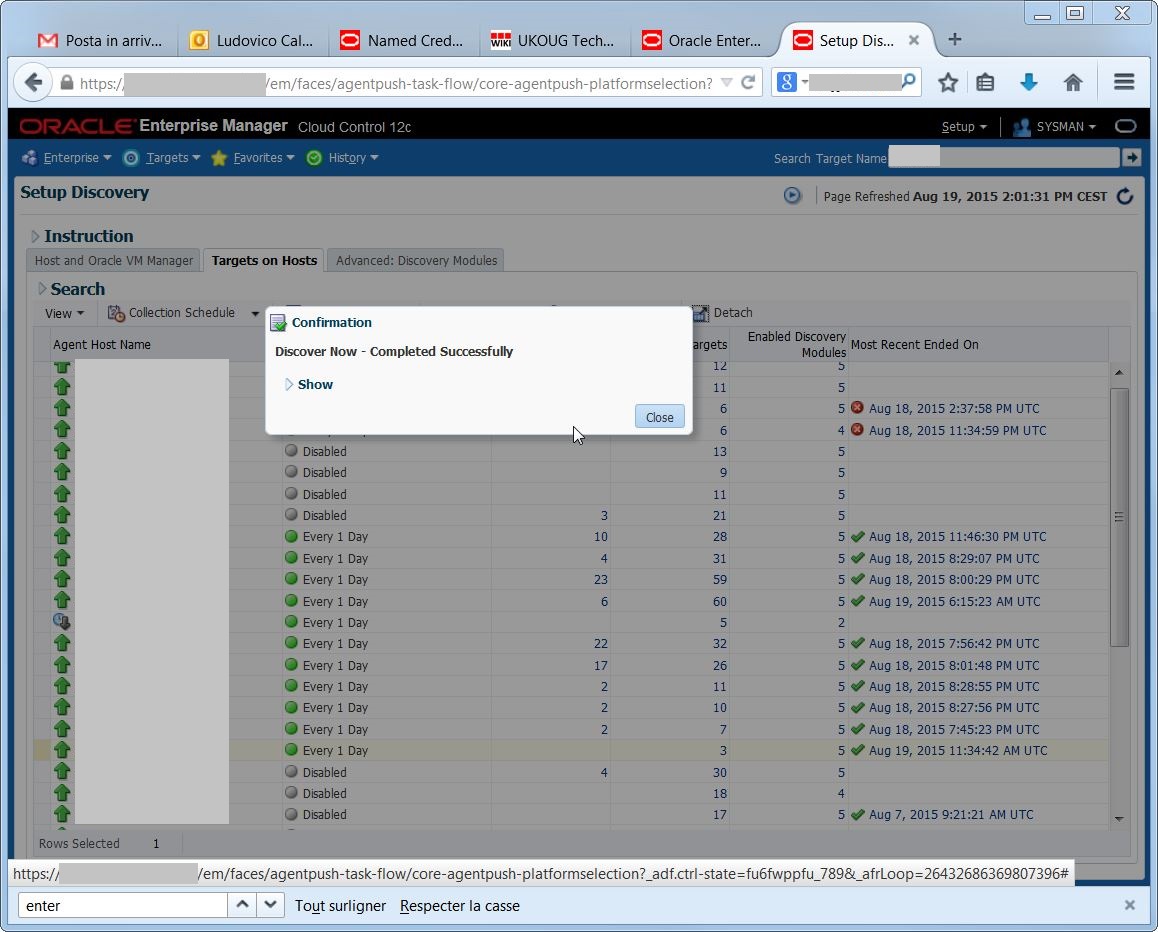
But the discovery does not find my MySQL targets. What went wrong?
Each agent has a default list of “discovery modules” used for the discovery, but by default the MySQL one is not enabled after I install the plugin:
so it is necessary to activate it and deactivate the discovery modules I do not need:
Tada! at the next discovery, I have my target available:
The target name is automatically set to hostname:mysqlport:
as all discovered targets, I need to promote it to have it available for monitoring with EM12c:
The target is available, now I can use most of the EM12c features to monitor my MySQL environment.
I’ve read the recent good post from my friend Rene on Pythian’s Blog about how to troubleshoot when user ulimits are different from what specified in limits.conf:
Once you fix the problem, you may want to check (any maybe monitor) when an instance is running with a wrong value (and maybe encounter the famous Error message: Linux-x86_64 Error: 23: Too many open files in system).
I’ve had the chance to propose a POC on MEM 3.0 to a customer currently relying on MEM 2.3, so we set up a VM to make some tests on it. I want to share my very first experience with it.
The binaries
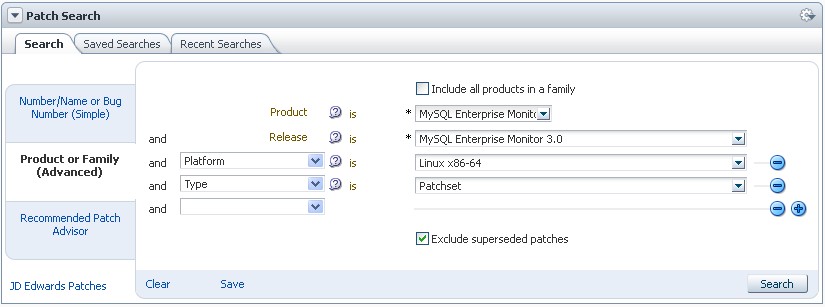
The binaries you can download from edelivery belong to the “base” 3.0.2 version. But the release 3.0.3 is available since November 1st: in order to get it you must download two patchsets from the My Oracle Support. (Patches & Updates).
Patch 17721950: MySQL Enterprise Monitor Service Manager 3.0.3 for Linux x86 (64-bit)
Patch 17721960: MySQL Enterprise Monitor Agent 3.0.3 for Linux x86 (64-bit)
So, as it is for Oracle RDBMS, now the new versions are released as patchsets that can be installed from scratch.
The installation
The installation of the new product is as straightforward as it was for the previous release. You can still choose between using an existent MySQL database or a new one created my the installer. The installation steps have not changed at all, so I won’t list them here.
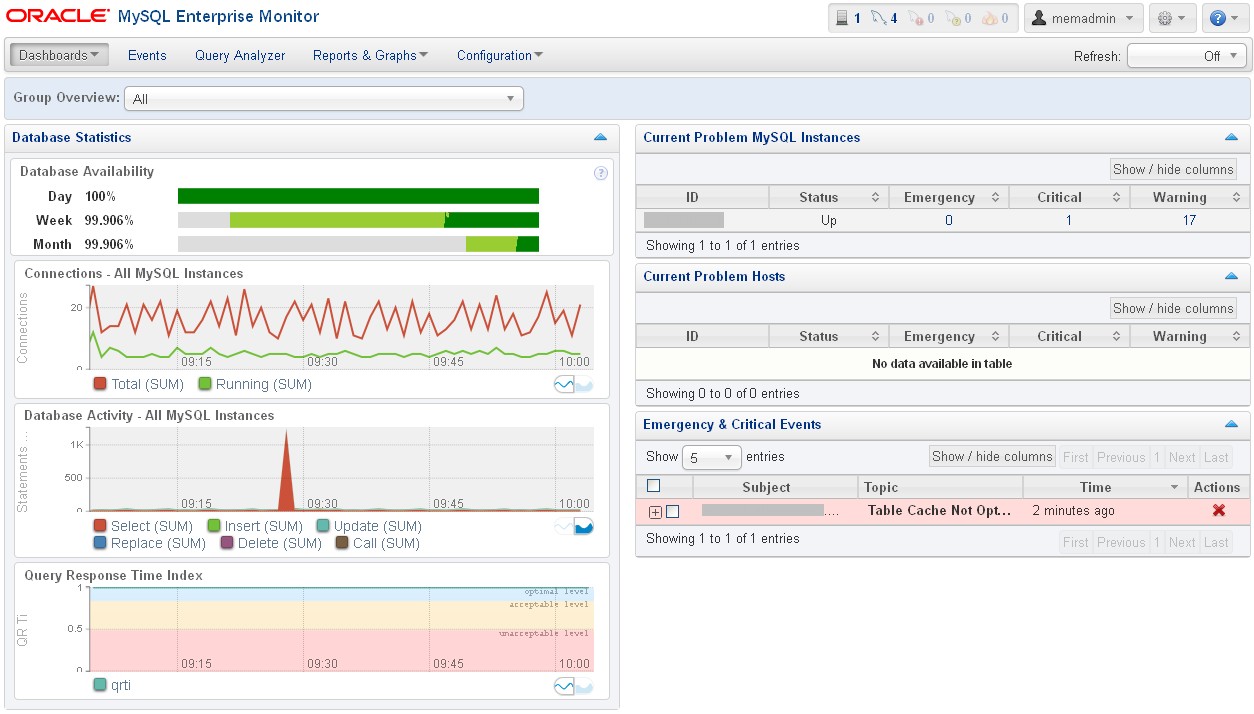
MEM3 comes with a new graphic vest, definitely more “Oracle style” and eye-candy. Globally I have to say that the experience is really improved. The overview page resumes well the overall availability, workload and alerts.
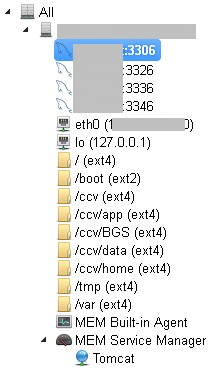
The new graph browser allows to choose the correspondent object from the left tree-view pane. You can see from the screenshot that now the agent collects data from the system and regroup the items differently, e.g. the filesystems are now separated objects belonging to the server.
New agent behavior
The new MySQL Enterprise Agent brings some benefits comparing to the old one. Now a single agent installation can monitor all database instances on the server and actively discover new ones.
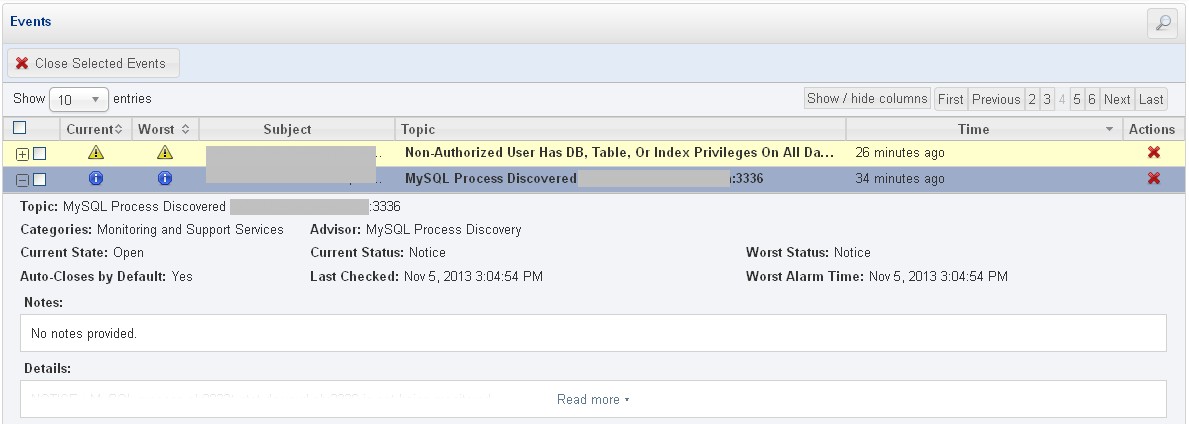
When a new instance is discovered is not monitored by default: an event is raised so you can create an handle that sends you an email that reminds to enable the monitoring for that instance.
Other remarks
The Query Analyzer is now active by default for instances that have the performance_schema enabled.
Many new graphs are displayed by default providing great information on database statistics trends.
The Event Handling is simpler to manage IMO, but the only choices are still sending an email and/or an SNMP trap. I regret that it’s still impossible to take actions like hooking shell scripts or send WS calls.
The other functionalities are still present and basically unchanged.
Conclusion
Oracle have done a very good job in restyling everything. The new Enterprise Monitor dashboard is really responsive and I haven’t found bugs so far. But I have to say that there is still a lack of features that would make it really “enterprise ready”, such as a plugin mechanism that would allow to interact directly with common event management softwares like EM12c, Tivoli, Remedy or CA SM without relying on SNMP only. Also, it would be great to run actions directly when an event raises.
The POC however has been a complete success and we’ll start next week with the definitive migration! 🙂
In my previous post I’ve shown how to collect data and insert it into a database table using PowerShell. Now it’s time to get some information from that data, and I’ve used TSQL for this purpose.
The backup exceptions
Every environment has some backup rules and backup exceptions. For example, you don’t want to check for failures on the model, northwind, adventureworks or distribution databases.
I’ve got the rid of this problem by using the “exception table” created in the previous post. The rules are defined by pattern matching. First we need to define a generic rule for our default backup schedules:
PgSQL
1
2
3
4
5
6
INSERTINTO[Tools].[dbo].[DB_Backup_Exceptions]
([InstanceName],[DatabaseName],[LastFullHours]
,[LastLogHours],[Description],[BestBefore])
VALUES
('%','%',36,12,'Default delays for all databases',NULL)
GO
In the previous example, we’ll check that all databases (‘%’) on all instances (again ‘%’) have been backed up at least every 36 hours, and a backup log have occurred in the last 12 hours. The description is useful to remember why such rule exists.
The “BestBefore” column allows to define the time limit of the rule. For example, if you do some maintenance and you are skipping some schedules, you can safely insert a rule that expires after X days, so you can avoid some alerts while avoiding also to forget to delete the rule.
PgSQL
1
2
3
4
5
6
INSERTINTO[Tools].[dbo].[DB_Backup_Exceptions]
([InstanceName],[DatabaseName],[LastFullHours]
,[LastLogHours],[Description],[BestBefore])
VALUES
('SERVER1','%',1000000,1000000,'Maintenance until 012.05.2013','2013-05-12 00:00:00')
GO
The previous rule will skip backup reports on SERVER1 until May 12th.
Oracle PL/SQL
1
2
3
4
5
6
INSERTINTO[Tools].[dbo].[DB_Backup_Exceptions]
([InstanceName],[DatabaseName],[LastFullHours]
,[LastLogHours],[Description],[BestBefore])
VALUES
('%','Northwind',1000000,1000000,'Don''t care about northwind',NULL)
GO
The previous rule will skip all reports on all Northwind databases.
Important: If multiple rules apply to the same database, the rule with a higher time threshold wins.
The queries
The following query lists the databases with the last backup full older than the defined threshold:
Checking database backups has always been one of the main concerns of DBAs. With Oracle is quite easy with a central RMAN catalog, but with other databases doing it with few effort can be a great challenge.
Some years ago I developed a little framework to control all SQLServer databases. This framework was based on Linux (strange but true!), bash, freetds, sqsh and flat configuration files. It’s still doing well its work, but not all SQLServer DBAs can deal with complex bash scripting, so a customer of mines asked me if I was able to rewrite it with a language Microsoft-like.
So I decided to go for a PowerShell script in conjunction with a couple of tables for the configuration and the data, and a simple TSQL script to provide HTML reporting. I have to say, I’m not an expert on PowerShell, but it’s far from being as flexible as other programming languages (damn, comparing to perl, python or php they have in common only the initial ‘P’). However I managed to do something usable.
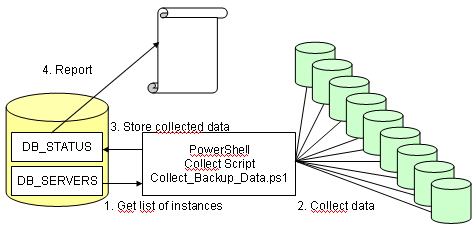
The principle
This is quite simple: the PowerShell script looks up for the list of instance in a reference table, then it sequentially connect to and retrieves the data:
recovery mode
status
creation time
last full backup
last log backup
This data is merged into a table on the central repository. Finally, a TSQL script do some reporting.
Custom classes in powershell
One of the big messes with PowerShell is the lack of the definition for custom classes, this is a special mess if we consider that PowerShell is higly object-oriented. To define your own classes to work with, you have to define them in another language (C# in this example):
PowerShell
1
2
3
4
5
6
7
8
9
10
11
12
13
14
15
16
17
18
19
20
21
22
23
24
25
26
27
28
Add-Type@'
using System;
public class DatabaseBackup
{
public string instanceName;
public string databaseName;
public string recoveryMode;
public string status;
public DateTime creationTime;
public DateTime lastFull;
public DateTime lastLog;
private TimeSpan diff;
public double lastFullTotalHours () {
diff = DateTime.Now - lastFull;
return Math.Round(diff.TotalHours,2);
}
public double lastLogTotalHours () {
diff = DateTime.Now - lastLog;
return Math.Round(diff.TotalHours,2);
}
}
'@
For better code reading, I’ve put this definition in a separate file (DatabaseBackup.ps1).
where type ='L' and backup_finish_date <= getdate()
group by database_name
) c
on d.name = c.database_name
where d.name <> 'Tempdb'
order by [LastFull]";
I’ve also put this snippet in a separate file queries.ps1 to improve readability.
The tables
The first table (DB_Servers) can be as simple as a single column containing the instances to check. This can be any other kind of source like a corporate CMDB or similar.
The second table will contain the data collected. Off course it can be expanded!
The third table will contain some rules for managing exceptions. Such exceptions can be useful if you have situations like “all databases named northwind should not be checked”. I’ll show some examples in the next post.
$instances=invoke-sqlcmd-Query"select [name]=db_instance from db_servers"-ServerInstance$serverName-Database$databasename
Finally, for each instance we have to check, we trigger the function that collects the data and we insert the results in the central repository (I’m using a merge to update the existent records).
You can’t use the internal powershell of SQLServer because it’s not full compatible with powershell 2.0.
Check that the table db_status is getting populated
Limitations
The script use Windows authentication, assuming you are working with a centralized domain user. If you want to use the SQL authentication (example if you are a multi-tenant managed services provider) you need to store your passwords somewhere…
This script is intended to be used with single instances. It should works on clusters but I haven’t tested it.
Check the backup chain up to the tape library. Relying on the information contained in the msdb is not a reliable monitoring solution!!
In my next post we’ll see how to generate HTML reports via email and manage exceptions.
Hope you’ll find it useful.
Again PLEASE, if you improve it, kindly send me back a copy or blog it and post the link in the comments!
Windows Performance Monitor is an invaluable tool when you don’t have external enterprise monitoring tools and you need to face performance problems, whether you have a web/application server, a mail server or a database server.
But what I don’t personally like of it is what you get in terms of graphing. If you schedule and collect a big amount of performance metrics you will likely get lost in adding/removing such metrics from the graphical interface.
What I’ve done long time ago (and I’ve done again recently after my old laptop has been stolen 🙁 ) is to prepare a PHP script that parse the resulting CSV file and generate automatically one graph for each metric that could be found.
Unfortunately, most of Windows Sysadmin between you will disagree that I’ve done this using a Linux Box. But I guess you can use my script if you install php inside cygwin. The other tool you need, is rrdtool, again I use it massively to resolve my graphing needs.
How to collect your data
Basically you need to create any Data Collector within the Performance Monitor that generates a log file. You can specify directly a CSV file (Log format: Comma separated) or generate a BLG file and convert it later (Log format: Binary). System dumps are not used, so if you use the standard Performace template, you can delete it from your collection.
Remember that the more counters you take, the more the graph generation will take. The script does not run in parallel, so it will use only one core. Generally:
Where (Speed factor) is depending on both the CPU speed and the disk speed because of the huge number of syncs required to update several thousands of files. I’ve tried to reduce the number of rrdupdates by queuing several update values in a single command line and I’ve noticed an important increase of performances, but I know it’s not enough.
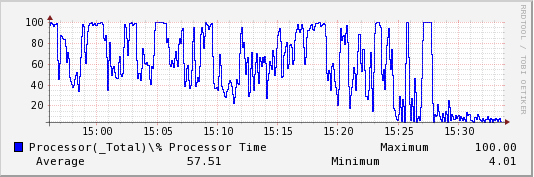
rrdtool graph/root/temp/LUDO/IPv4/Datagrams_Received_Unknown_Protocol.png--start"1366721762"--end"1366724017"--width453DEF:ds0=/root/temp/LUDO/IPv4/Datagrams_Received_Unknown_Protocol.rrd:value:LAST:step=5LINE1:ds0#0000FF:"IPv4\Datagrams Received Unknown Protocol" VDEF:ds0max=ds0,MAXIMUM VDEF:ds0avg=ds0,AVERAGE VDEF:ds0min=ds0,MINIMUM COMMENT:" " COMMENT:" Maximum " GPRINT:ds0max:"%6.2lf" COMMENT:" Average " GPRINT:ds0avg:"%6.2lf" COMMENT:" Minimum " GPRINT:ds0min:"%6.2lf"
534x177
...
Now it’s done!
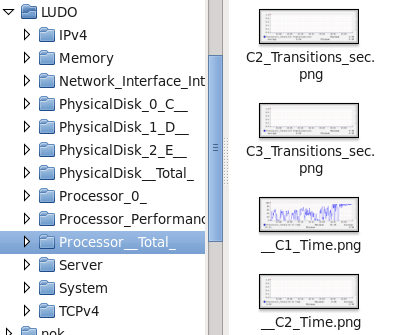
The script generate a folder with the name of the server (LUDO in my example) and a subfolder for each class of counters (as you see in Performance Monitor).
Inside each folder you will have a PNG (and an rrd) for each metric.
Important: The RRD are generated with a single round-robin archive with a size equal to the number of samples. If you want to have the rrd to store your historical data you’ll need to modify the script. Also, the size of the graph will be the same as the number of samples (for best reading), but limited to 1000 to avoid huge images.
Future Improvements
Would be nice to have a prepared set of graphs for standard graphs with multiple metrics (e.g. CPU user, system and idle together) and additional lines like regressions…
Download the script: process_l_php.txtand rename it with a .php extension.
Hope you’ll find it useful!
Cheers
Ludo
This website uses cookies to improve your experience. We'll assume you're ok with this, but you can opt-out if you wish.Accept
Privacy & Cookies Policy
Privacy Overview
This website uses cookies to improve your experience while you navigate through the website. Out of these, the cookies that are categorized as necessary are stored on your browser as they are essential for the working of basic functionalities of the website. We also use third-party cookies that help us analyze and understand how you use this website. These cookies will be stored in your browser only with your consent. You also have the option to opt-out of these cookies. But opting out of some of these cookies may affect your browsing experience.
Necessary cookies are absolutely essential for the website to function properly. This category only includes cookies that ensures basic functionalities and security features of the website. These cookies do not store any personal information.
Any cookies that may not be particularly necessary for the website to function and is used specifically to collect user personal data via analytics, ads, other embedded contents are termed as non-necessary cookies. It is mandatory to procure user consent prior to running these cookies on your website.


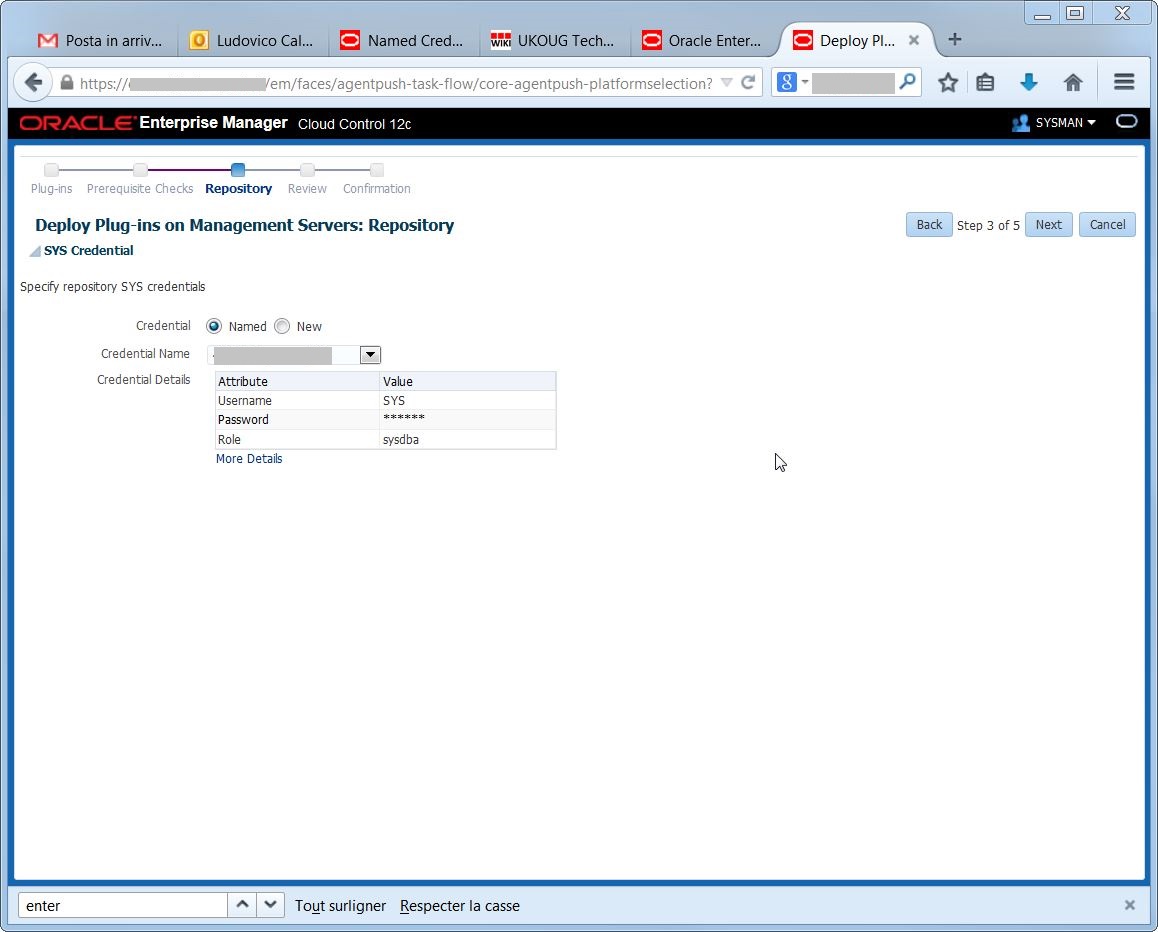 Execute the deploy:
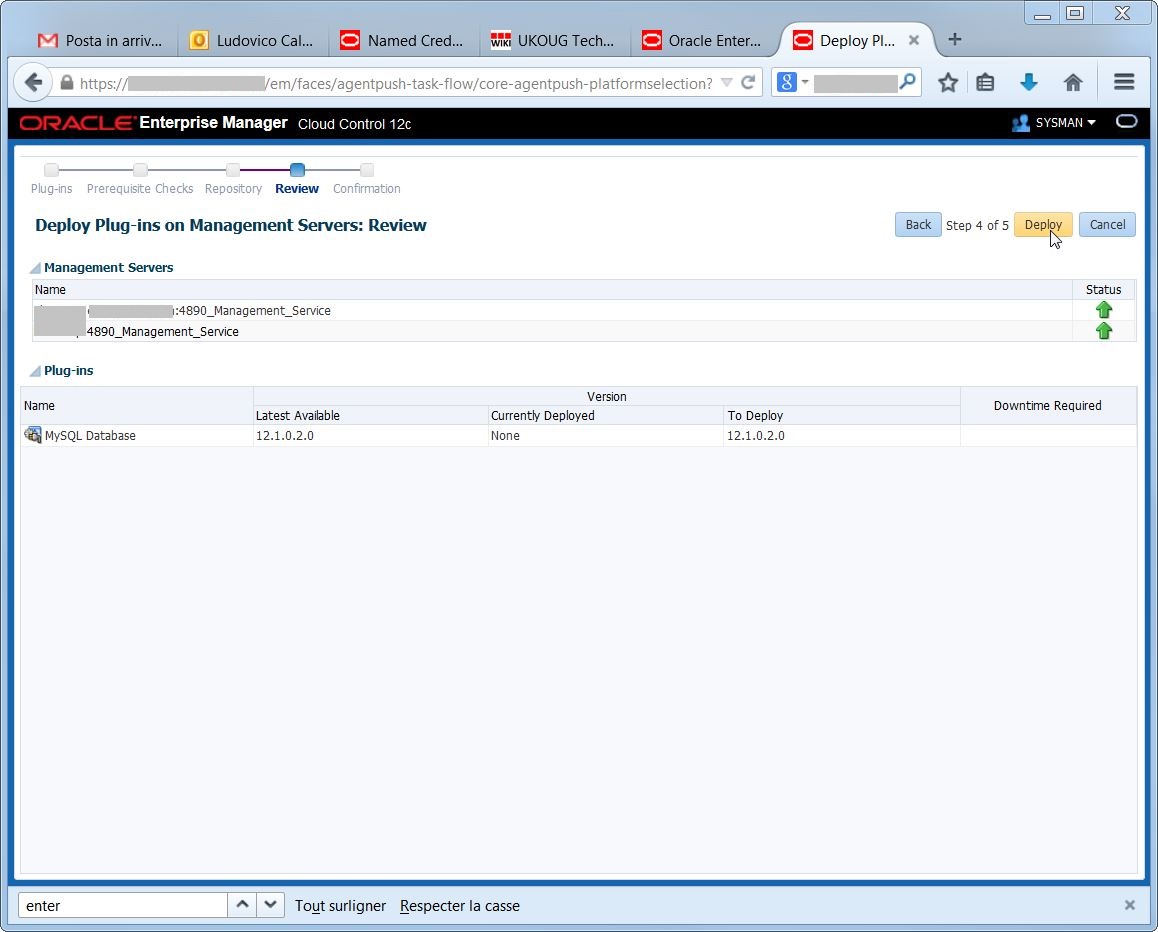 If everything went OK, I’m able to check the status of the deployment:
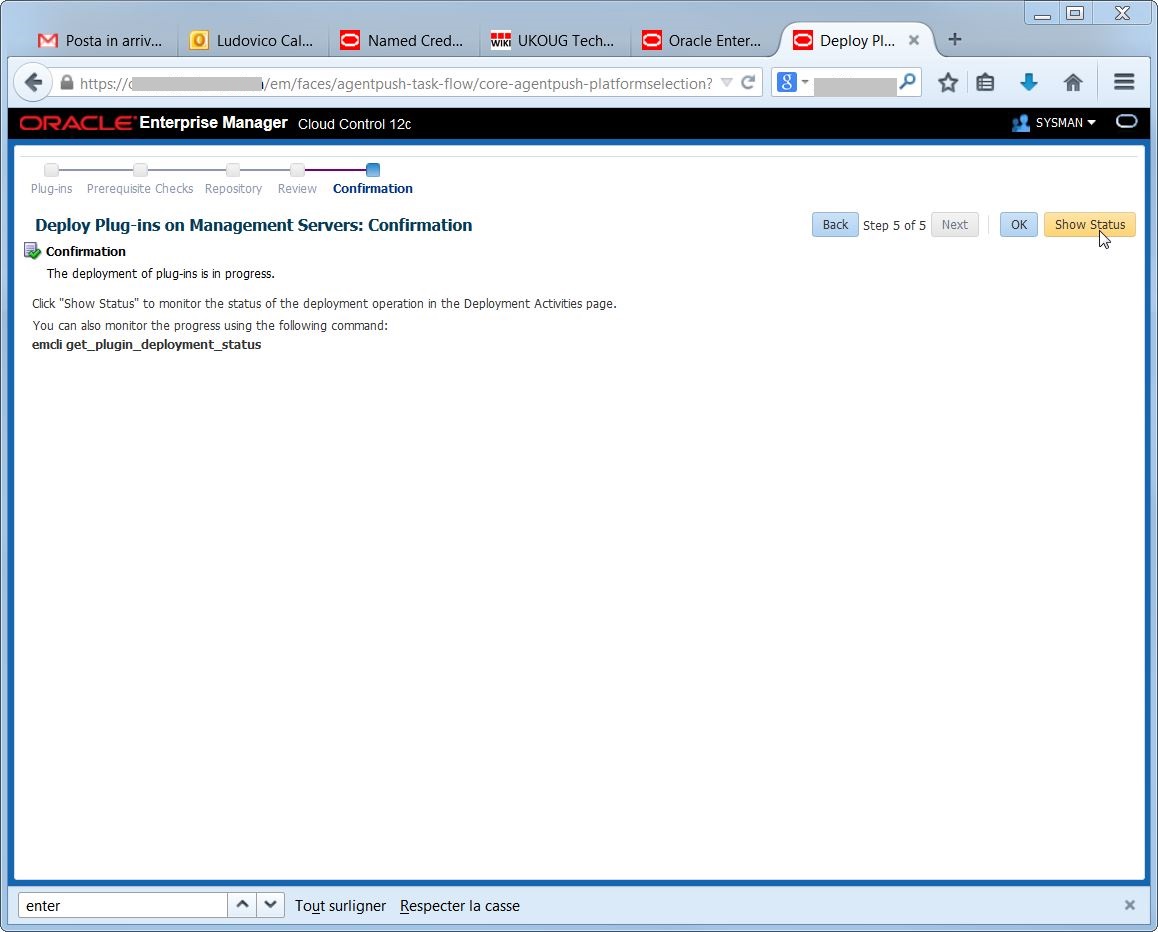
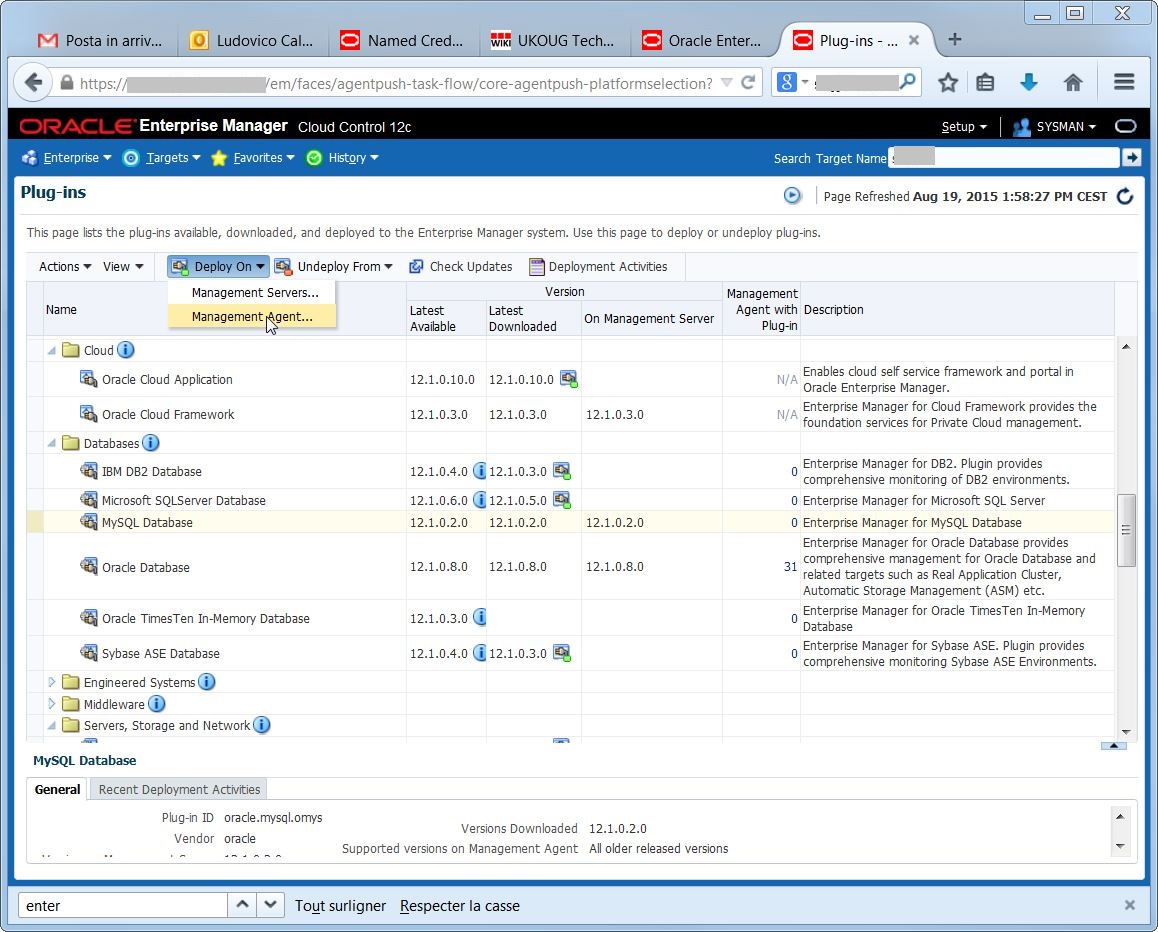
 I must select one by one the agents that run on the hosts where I have MySQL running. I may select all agents as well, but it’s better to be neat…
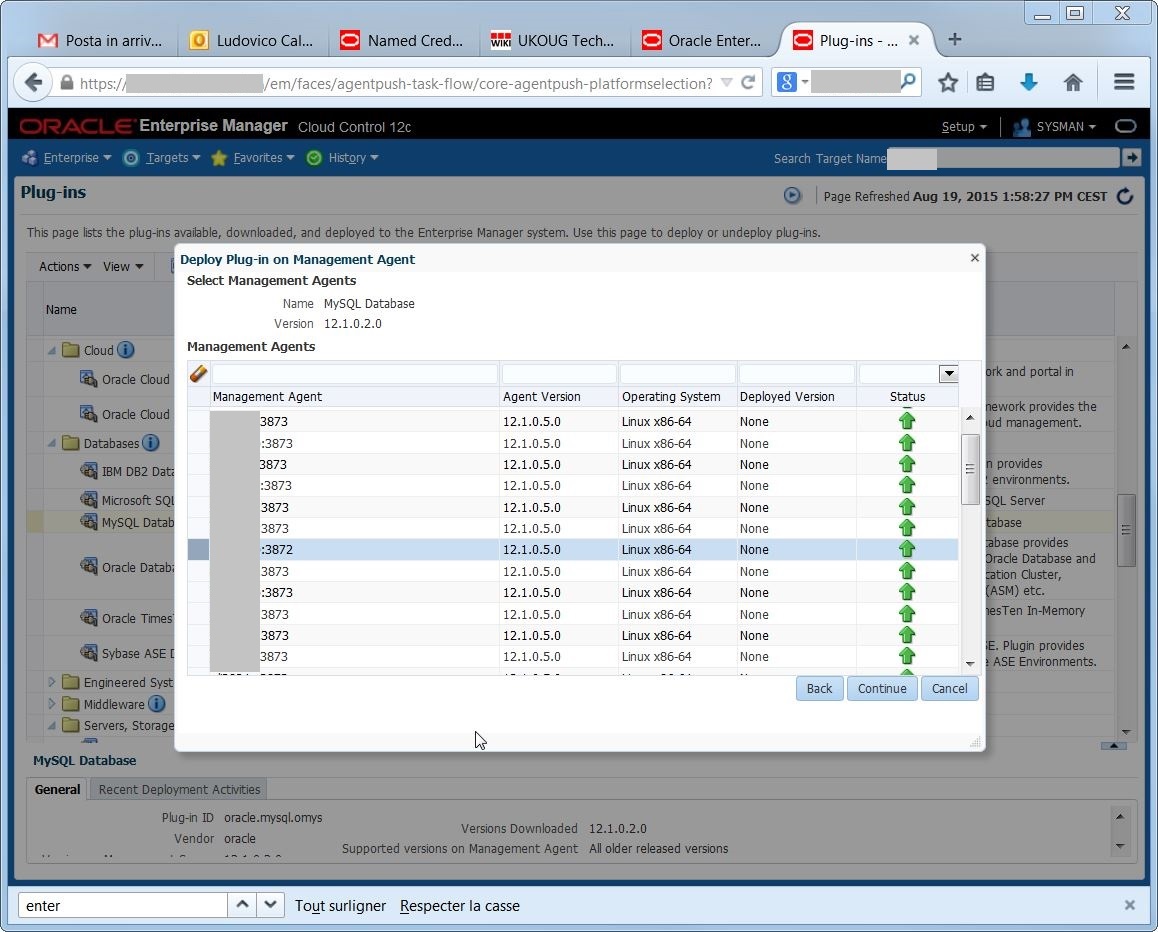 again, there are prerequisite checks and confirmations:
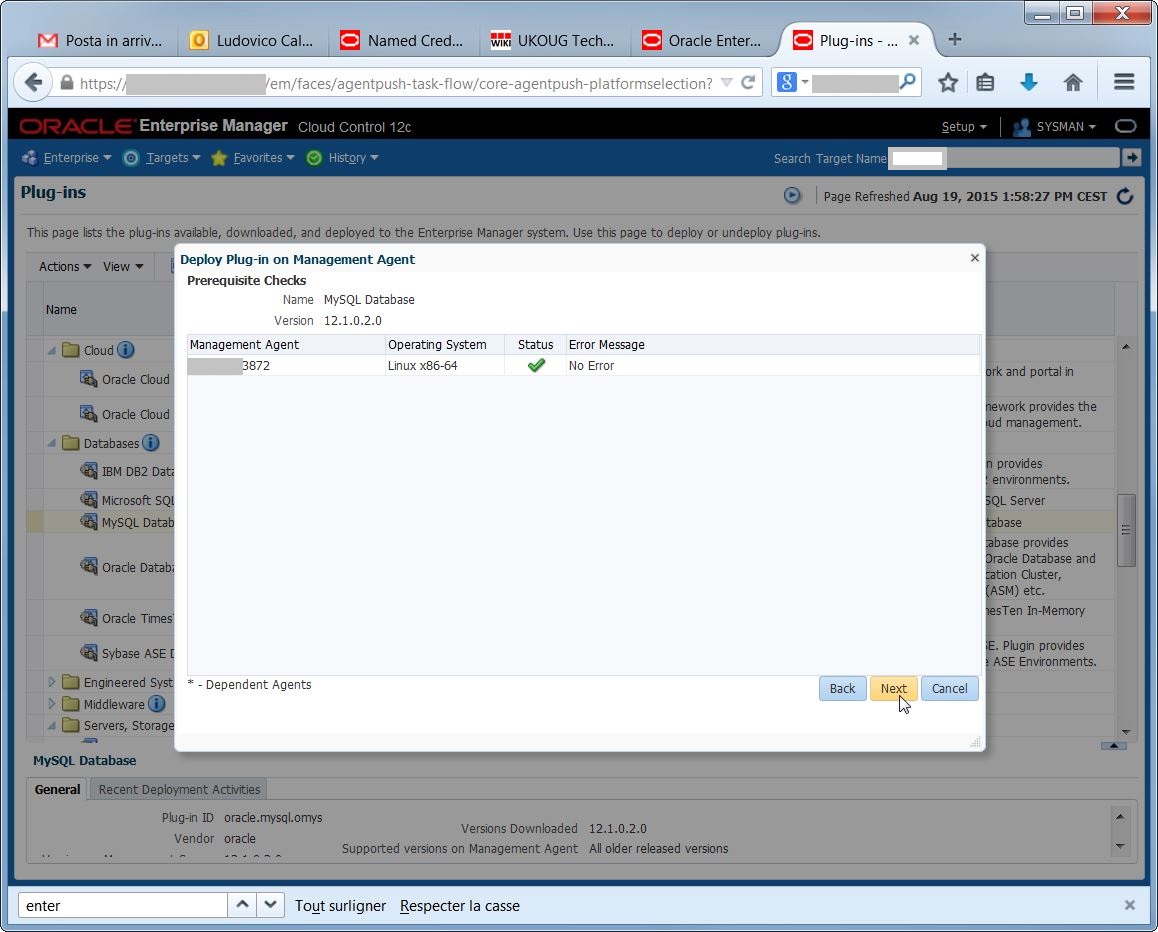
 The plugin deployment went well:
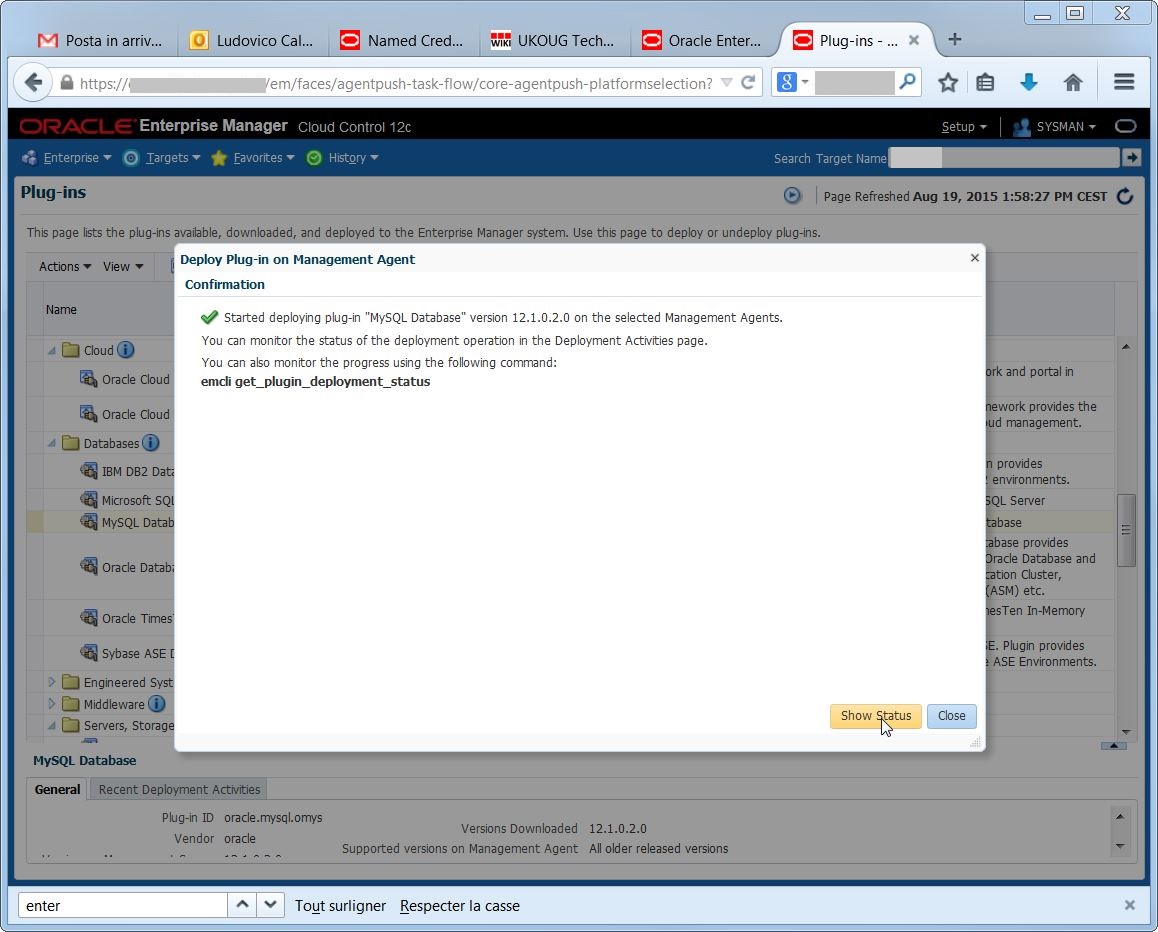
 Now I can run the target discovery on the agent:
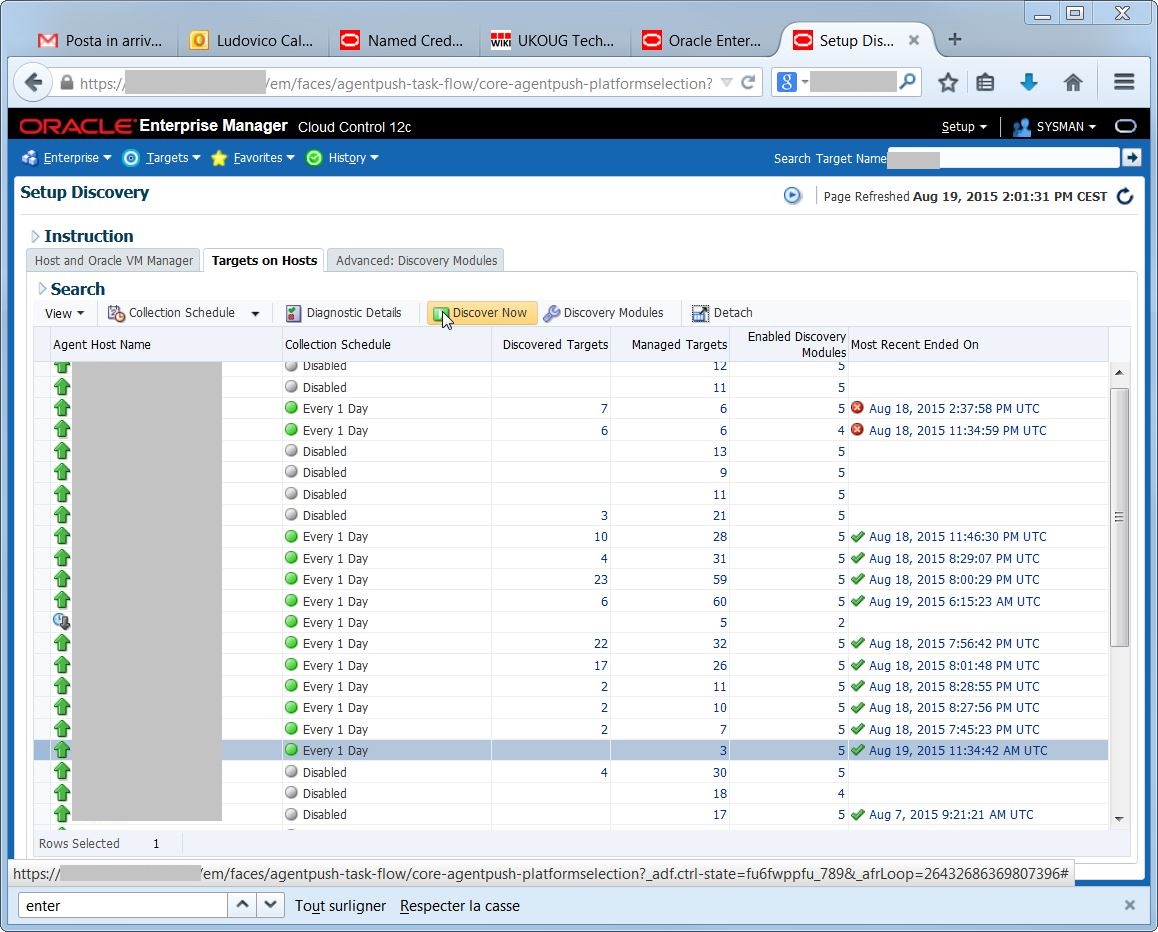
 Each agent has a default list of “discovery modules” used for the discovery, but by default the MySQL one is not enabled after I install the plugin:
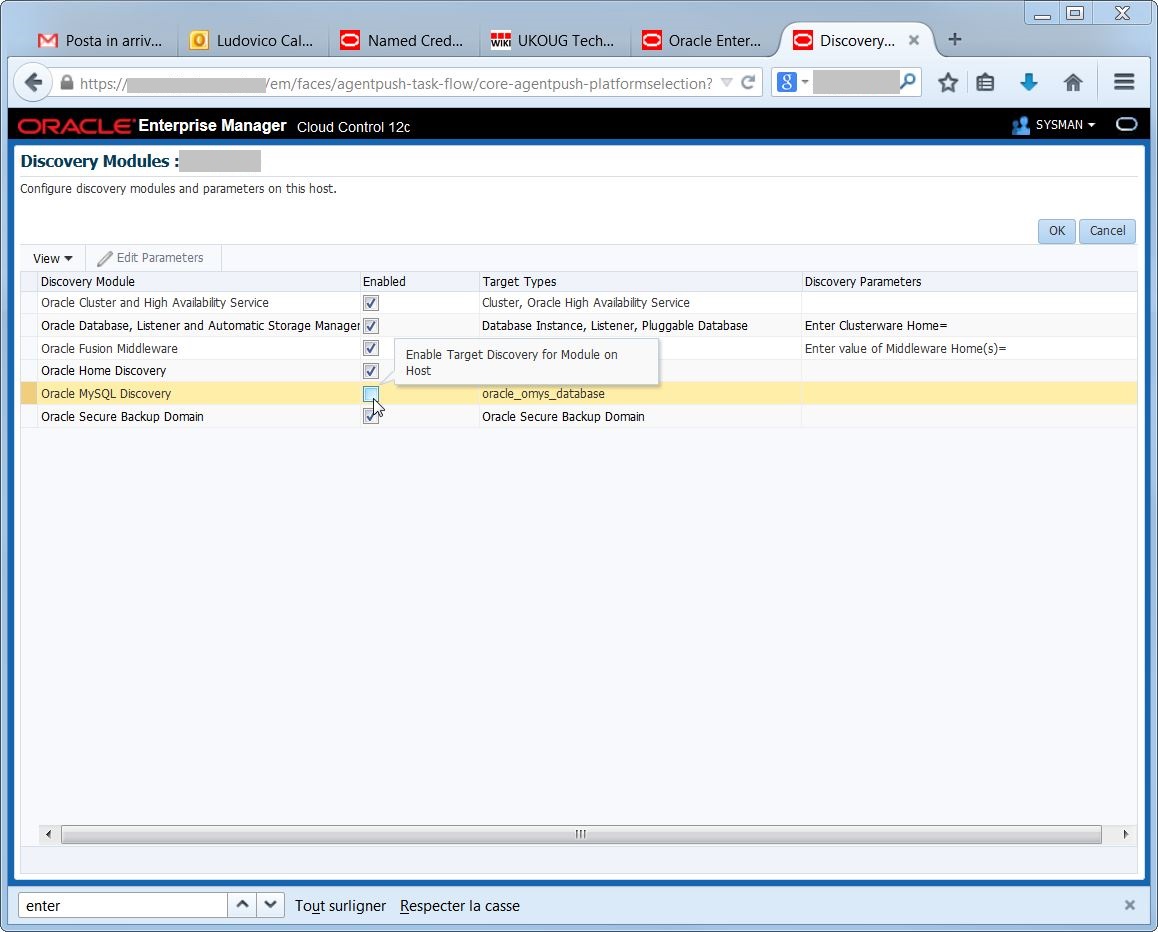 so it is necessary to activate it and deactivate the discovery modules I do not need:
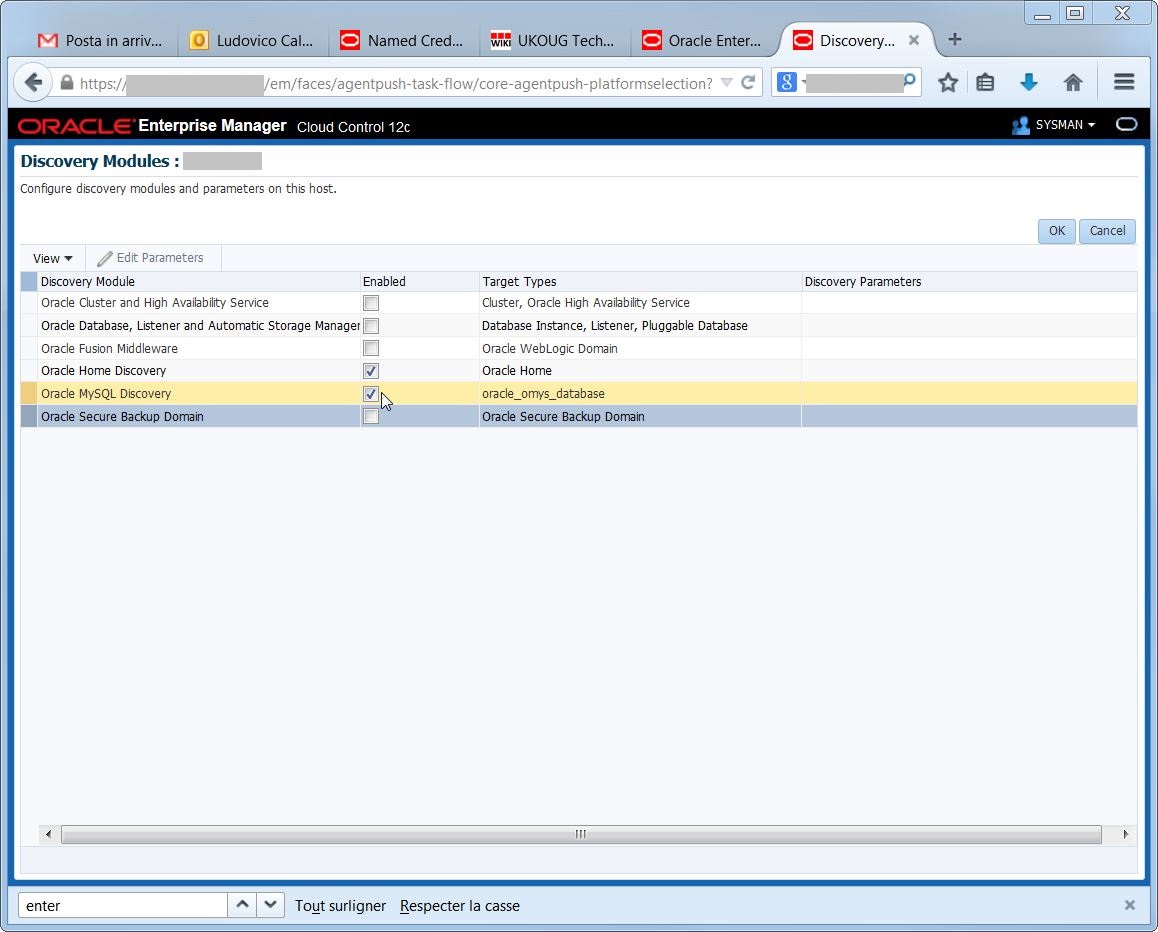 Tada! at the next discovery, I have my target available:
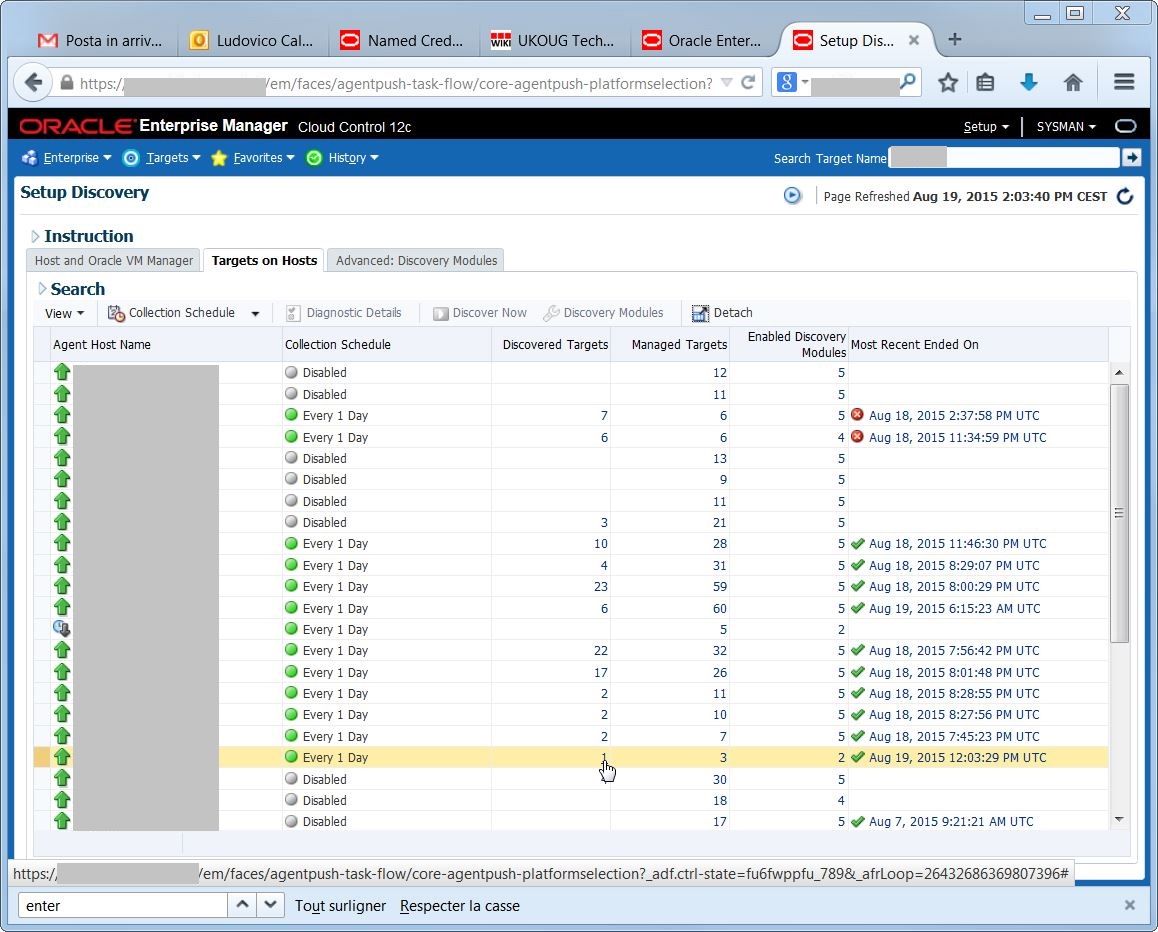 The target name is automatically set to hostname:mysqlport:
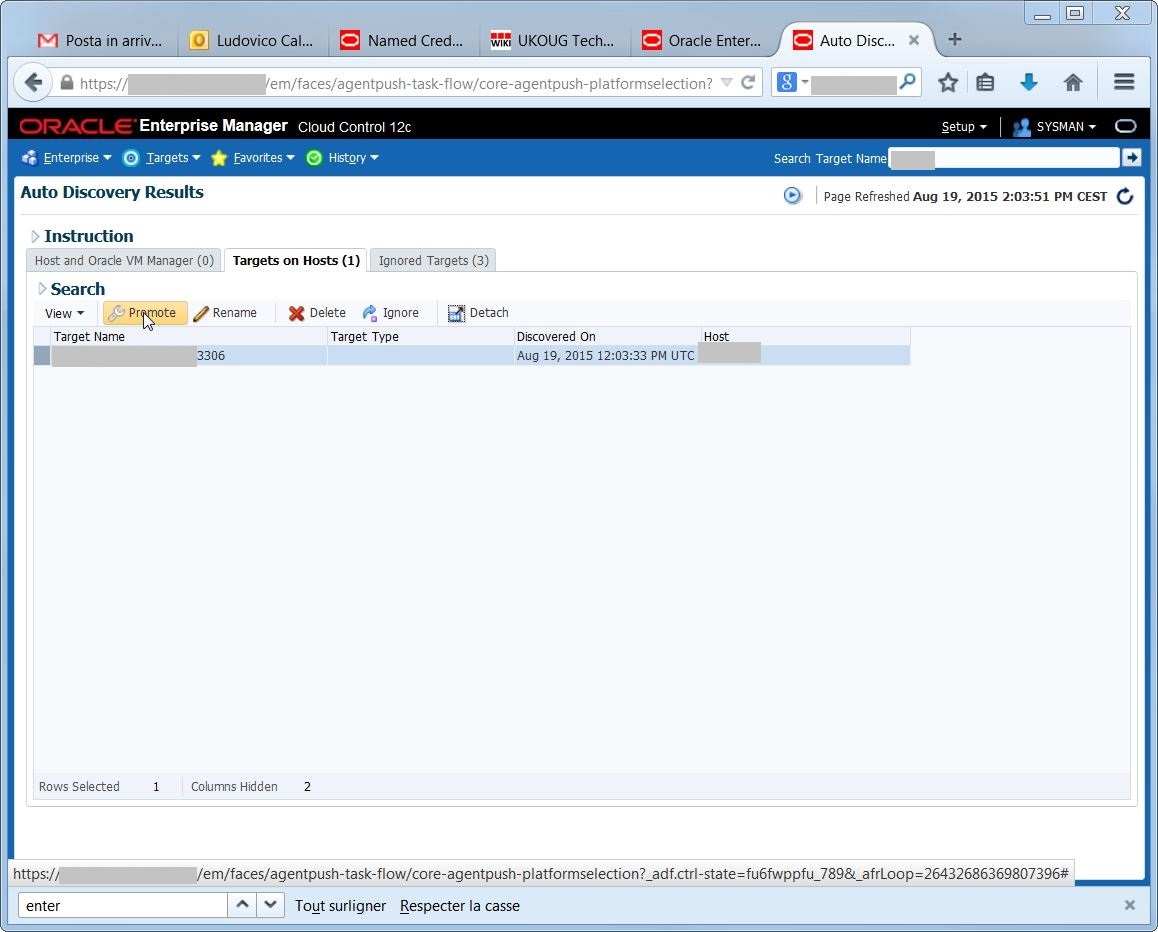 as all discovered targets, I need to promote it to have it available for monitoring with EM12c:
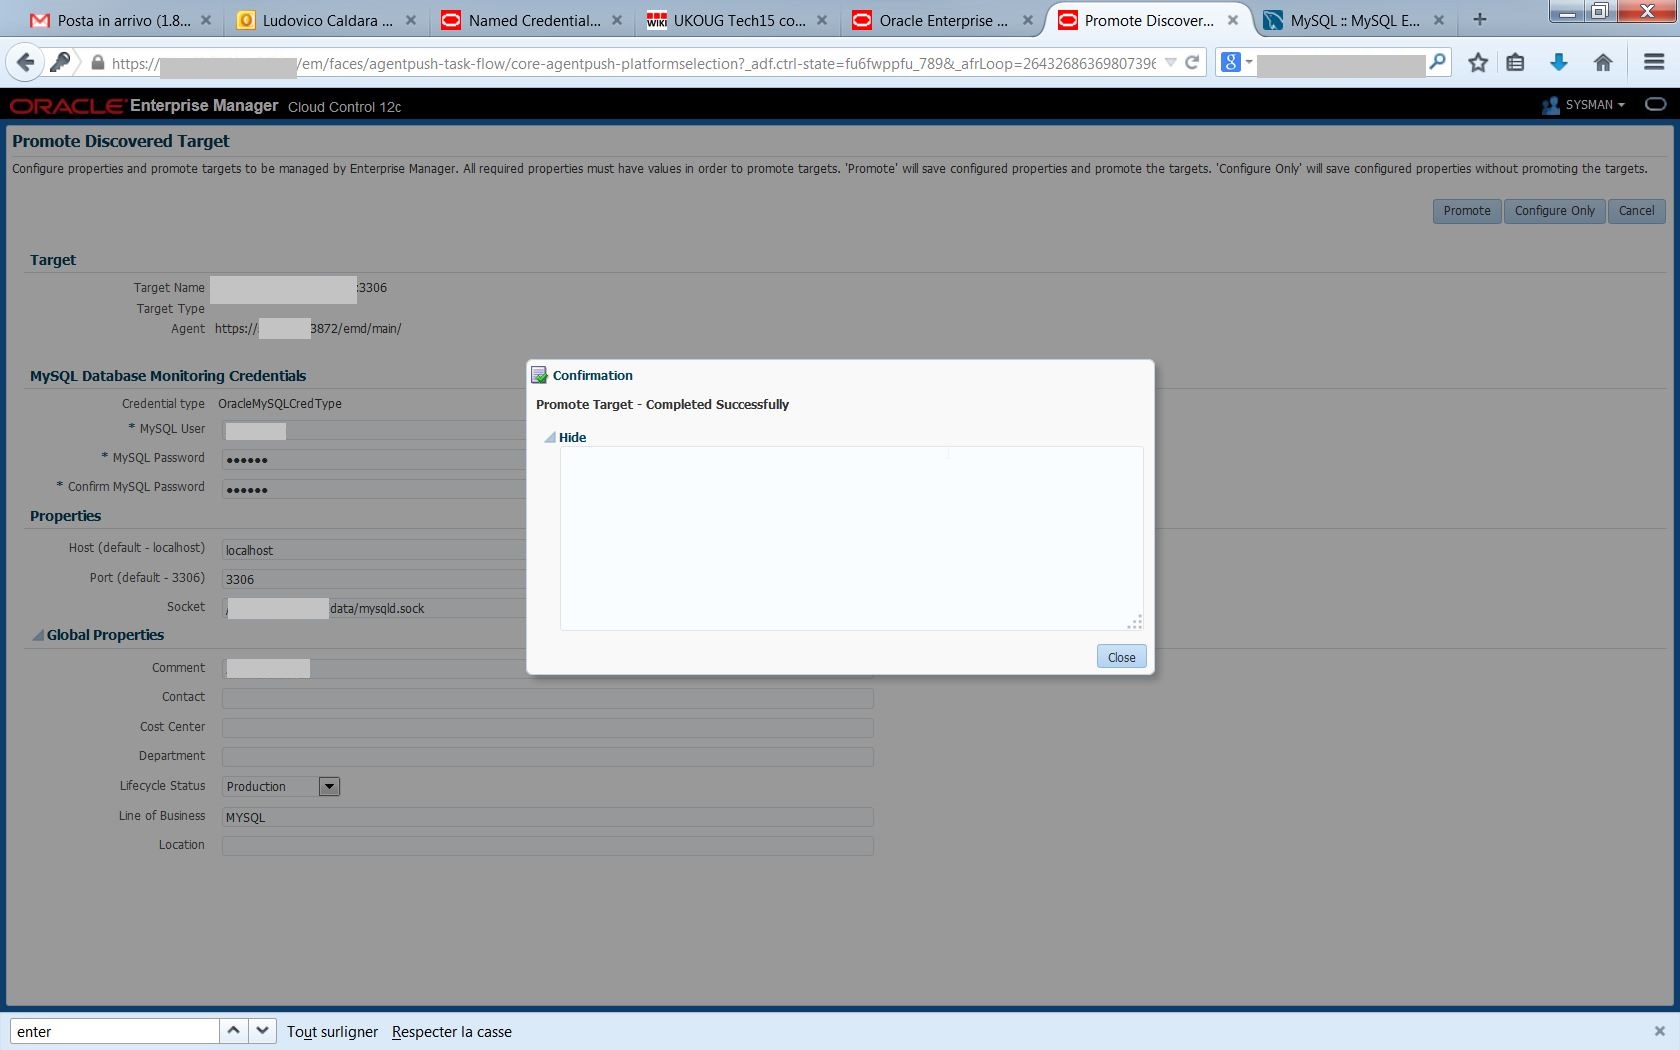 The target is available, now I can use most of the EM12c features to monitor my MySQL environment.
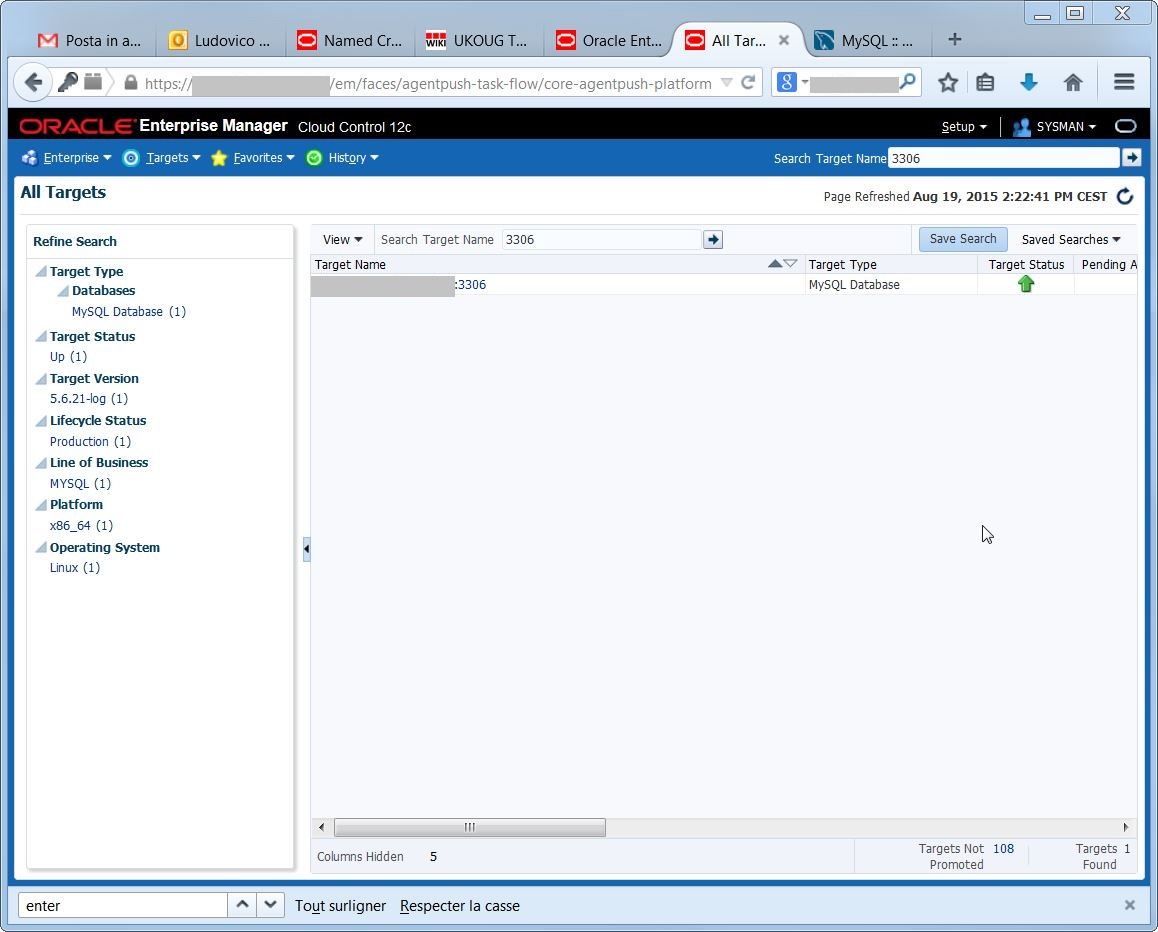 HTH
HTH