
Assumptions
- You have many (hundreds) of instances and more than a couple of servers
- One of your servers have high CPU Load
- You have Enterprise Manager 12c but the Database Load does not filter by server
- You want to have an historical representation of the user CPU utilization, per instance
Getting the data from the EM Repository
With the following query, connected to the SYSMAN schema of your EM repository, you can get the hourly max() and/or avg() of user CPU by instance and time.
|
1 2 3 4 5 6 7 8 9 10 11 12 |
SELECT entity_name, ROUND(collection_time,'HH') AS colltime, ROUND(avg_value,2)/16*100 AS avgv, -- 16 is my number of CPU ROUND(max_value,2)/16*100 AS maxv -- same here FROM gc$metric_values_hourly mv JOIN em_targets t ON (t.target_name =mv.entity_name) WHERE t.host_name ='myserver1' -- myserver1 is the server that has high CPU Usage AND mv.metric_column_name = 'user_cpu_time_cnt' -- let's get the user cpu time AND collection_time>sysdate-14 -- for the lase 14 days ORDER BY entity_name, ROUND(collection_time,'HH'); |
Suppose you select just the max value: the result will be similar to this:
|
1 2 3 4 5 6 7 8 9 10 11 12 13 14 15 16 17 18 19 20 21 22 23 24 25 26 27 28 29 30 31 32 33 34 35 36 37 38 39 40 41 42 |
ENTITY_ COLLTIME MAXV ------- ---------------- ------ mydbone 10.05.2017 16:00 0.3125 mydbone 10.05.2017 17:00 0.1875 mydbone 10.05.2017 18:00 0.1875 mydbone 10.05.2017 19:00 0.1875 mydbone 10.05.2017 20:00 0.25 mydbone 10.05.2017 21:00 0.125 mydbone 10.05.2017 22:00 0.125 mydbone 10.05.2017 23:00 0.125 mydbone 11.05.2017 00:00 0.1875 mydbone 11.05.2017 01:00 0.125 mydbone 11.05.2017 02:00 0.1875 mydbone 11.05.2017 03:00 0.1875 .... mydbone 23.05.2017 20:00 0.125 mydbone 23.05.2017 21:00 0.125 mydbone 23.05.2017 22:00 0.125 mydbone 23.05.2017 23:00 0.0625 mydbtwo 10.05.2017 16:00 0.3125 mydbtwo 10.05.2017 17:00 0.25 mydbtwo 10.05.2017 18:00 0.1875 mydbtwo 10.05.2017 19:00 0.1875 mydbtwo 10.05.2017 20:00 0.3125 mydbtwo 10.05.2017 21:00 0.125 mydbtwo 10.05.2017 22:00 0.125 mydbtwo 10.05.2017 23:00 0.125 ..... mydbtwo 14.05.2017 19:00 0.125 mydbtwo 14.05.2017 20:00 0.125 mydbtwo 14.05.2017 21:00 0.125 mydbtwo 14.05.2017 22:00 0.125 mydbtwo 14.05.2017 23:00 0.125 dbthree 10.05.2017 16:00 1.1875 dbthree 10.05.2017 17:00 0.6875 dbthree 10.05.2017 18:00 0.625 dbthree 10.05.2017 19:00 0.5625 dbthree 10.05.2017 20:00 0.8125 dbthree 10.05.2017 21:00 0.5 dbthree 10.05.2017 22:00 0.4375 dbthree 10.05.2017 23:00 0.4375 ... |
Putting it into excel
There are one million ways to do something more reusable than excel (like rrdtool scripts, gnuplot, R, name it), but Excel is just right for most people out there (including me when I feel lazy).
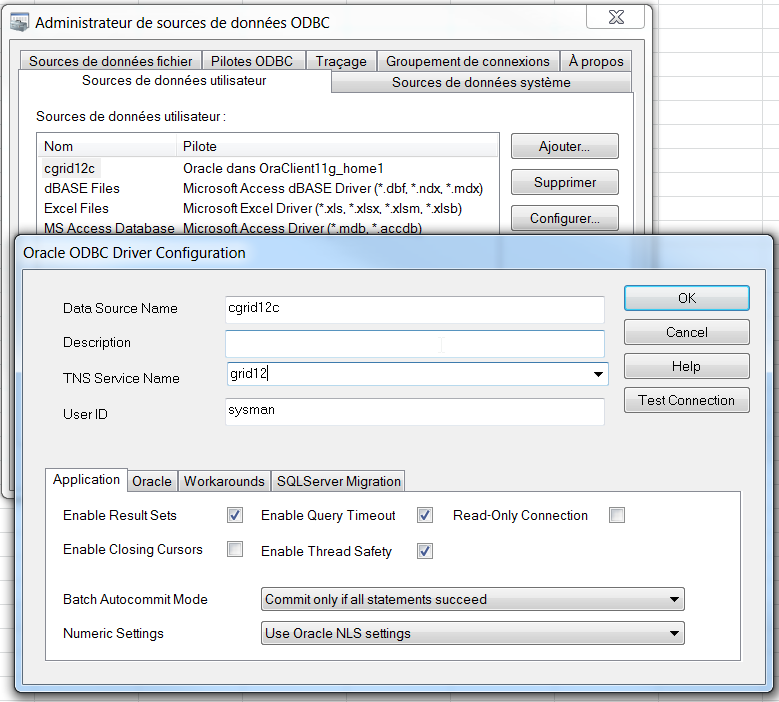
- Configure an Oracle Client and add the ODBC data source to the EM repository:
- Open Excel, go to “Data” – “Connections” and add a new connection:
- Search…
- New Source
- DSN ODBC
- Select your new ODBC data source, user, password
- Uncheck “Connection to a specific table”
- Give a name and click Finish
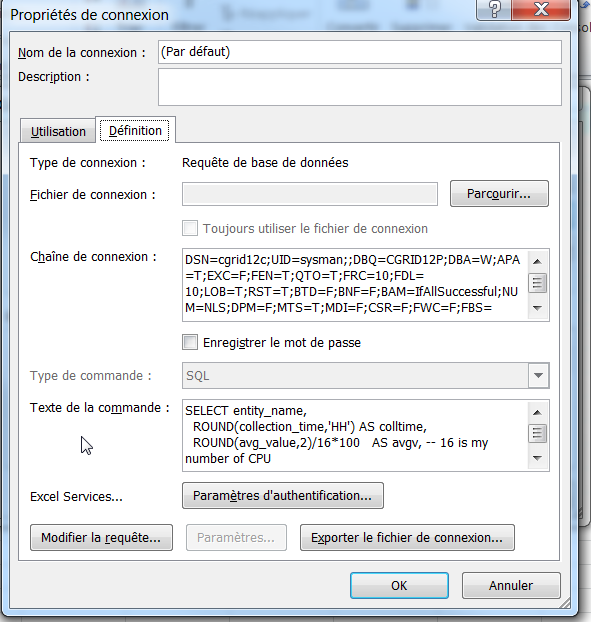
- On the DSN -> Properties -> Definition, enter the SQL text I have provided previously
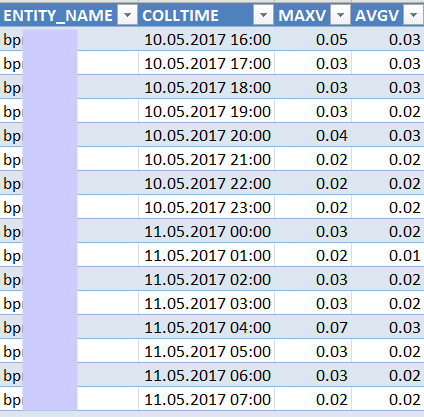
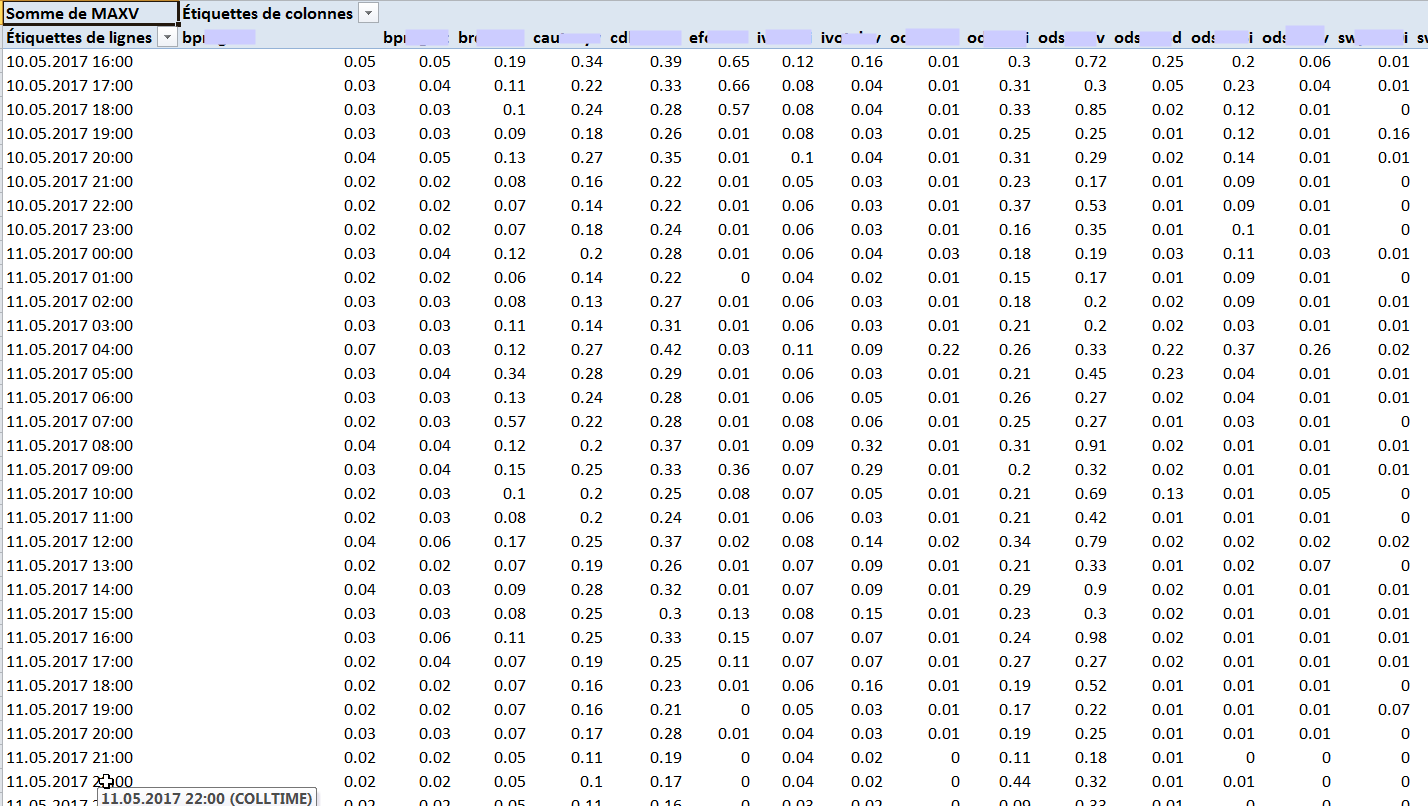
The result should be something similar: ( but much longer :-))
 Pivoting the results
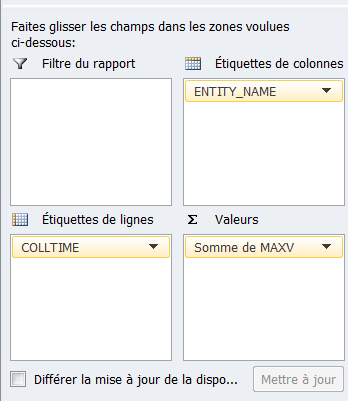
Create e new sheet and name it “pivot”, Click on “Create Pivot Table”, select your data and your dimensions:
 The result:
 Creating the Graph
Now that the data is correctly formatted, it’s easyy to add a graph:
just select the entire pivot table and create a new stacked area graph.
The result will be similar to this:
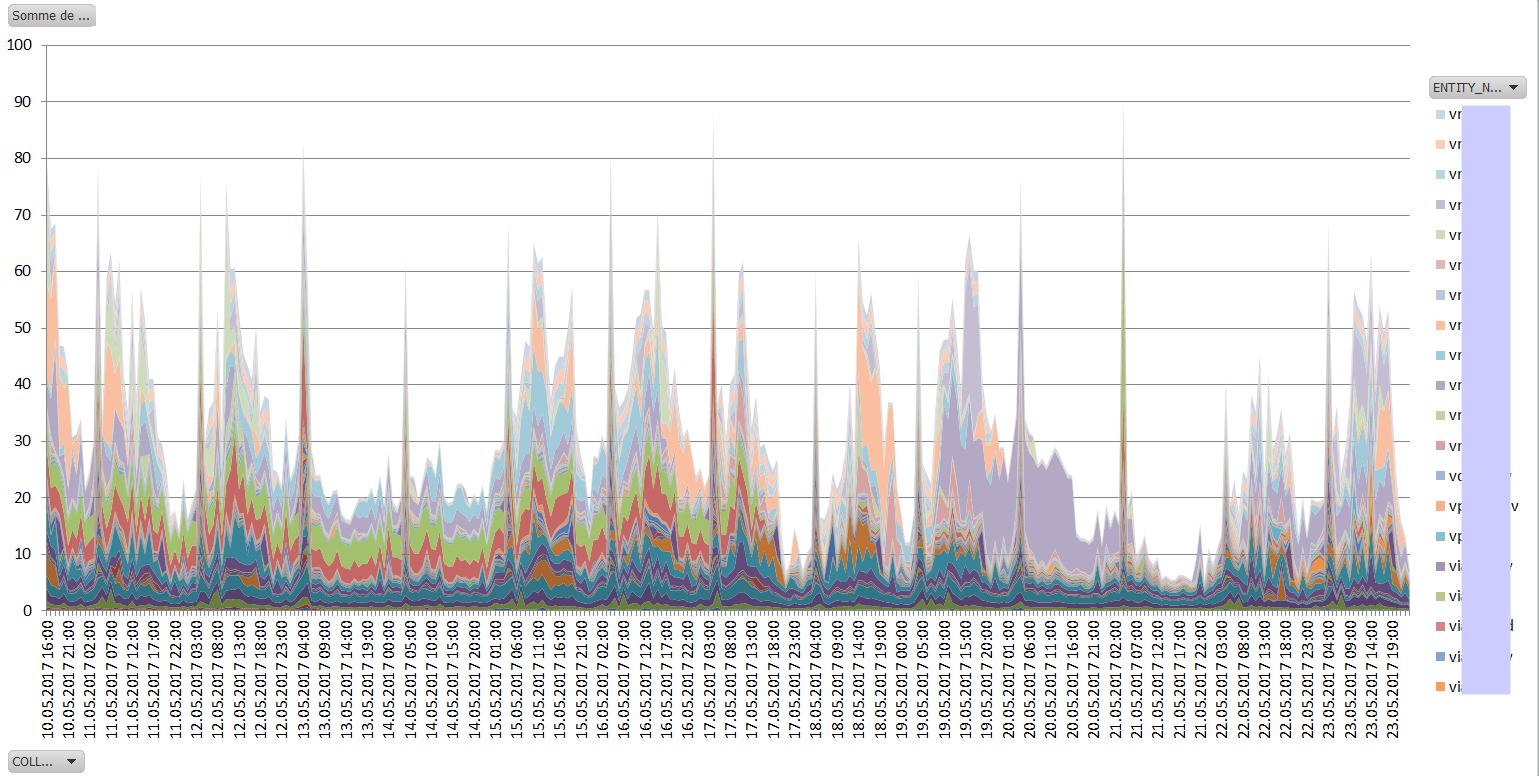
With such graph, it is easy to spot which databases consumed most CPU on the system in a defined period, and to track the progress if you start a “performance campaign”.
For example, you can see that the “green” and “red” databases were consuming constantly some CPU up to 17.05.2017 and then some magic solved the CPU problem for those instances.
It is also quite convenient for checking the results of new instance caging settings…
The resulting CPU will not necessarily be 100%: the SYS CPU time is not included, as well as the user CPU of all the other processes that are either not DB or not monitored with Enterprise Manager.
HTH
—
Ludovico
Latest posts by Ludovico (see all)
- Data Guard 26ai – #28: Fast-Start Failover Validation - April 17, 2026
- Data Guard 26ai – #27: Enhanced Observer Diagnostics - April 16, 2026
- Data Guard 26ai – #26: Fast-Start Failover Lag Histogram - April 7, 2026
Ludovico,
I have a quick question. Active Sessions Using CPU – ‘user_cpu_time_cnt’ captures only the CPU count used by the user, what can be done about CPU used by the system for the individual instance.
Also is there a similar metric of Memory ?
Thanks in advance
Dali
Thank you Ludovico. This is exactly what I need. I have an Exadata-full rack with CPU and Memory over-provisioned for DBs when compared to their actual usage. I would like to see the cpu usage history to better allocate CPU to each DB.
Appreciate your post.
Keep up the good work.
Cheers
Thanks Dali 🙂
The last 7 days, included the current one, can be displayed by changing the query with this one… It’s still an aggregation by hour, Excel is not good at displaying different series with different collection times…
SELECT entity_name,
ROUND(collection_time,’HH’) AS colltime,
round(sum(value)/count(*),2) AS avgv — same here
FROM gc$metric_values mv
JOIN em_targets t
ON (t.target_name =mv.entity_name)
WHERE t.host_name =’sli2577v’ — myserver1 is the server that has high CPU Usage
AND mv.metric_column_name = ‘user_cpu_time_cnt’ — let’s get the user cpu time
group by entity_name, ROUND(collection_time,’HH’)
ORDER BY entity_name,
ROUND(collection_time,’HH’);
Pingback: Which Oracle Databases use most CPU on my server? - Ludovico Caldara - Blogs - triBLOG