
During the MySQL Connect @ Open World, Oracle has announced the release of MySQL Enterprise Monitor 3.0.
I’ve had the chance to propose a POC on MEM 3.0 to a customer currently relying on MEM 2.3, so we set up a VM to make some tests on it. I want to share my very first experience with it.
The binaries
The binaries you can download from edelivery belong to the “base” 3.0.2 version. But the release 3.0.3 is available since November 1st: in order to get it you must download two patchsets from the My Oracle Support. (Patches & Updates).
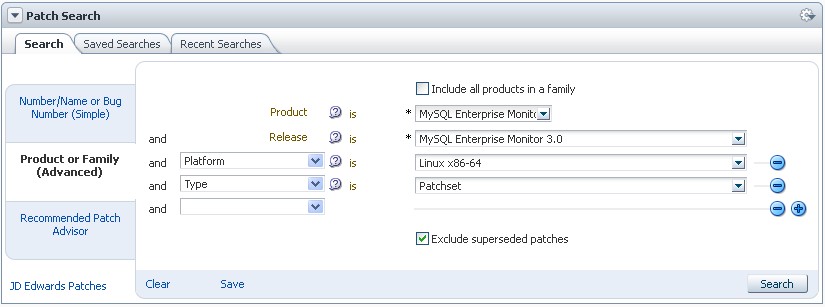
- Patch 17721950: MySQL Enterprise Monitor Service Manager 3.0.3 for Linux x86 (64-bit)
- Patch 17721960: MySQL Enterprise Monitor Agent 3.0.3 for Linux x86 (64-bit)
So, as it is for Oracle RDBMS, now the new versions are released as patchsets that can be installed from scratch.
The installation
The installation of the new product is as straightforward as it was for the previous release. You can still choose between using an existent MySQL database or a new one created my the installer. The installation steps have not changed at all, so I won’t list them here.
If you’re new to MEM installations, just refer to the official documentation.
New vest
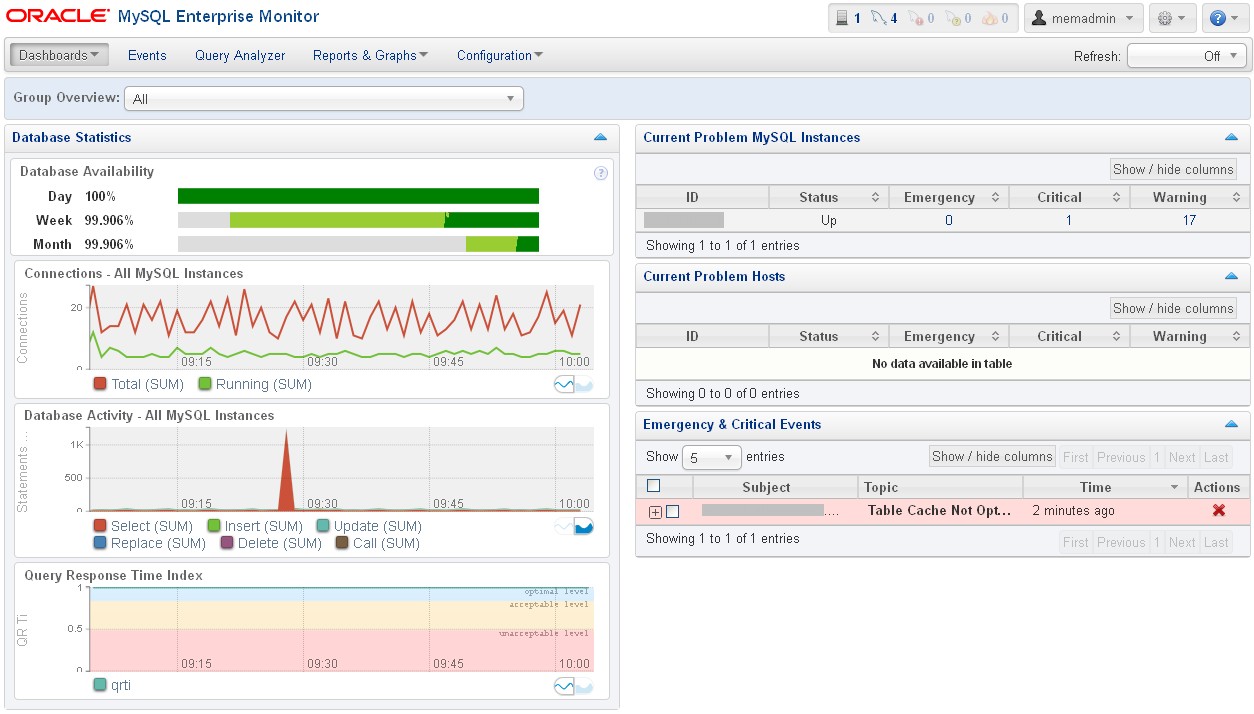
MEM3 comes with a new graphic vest, definitely more “Oracle style” and eye-candy. Globally I have to say that the experience is really improved. The overview page resumes well the overall availability, workload and alerts.
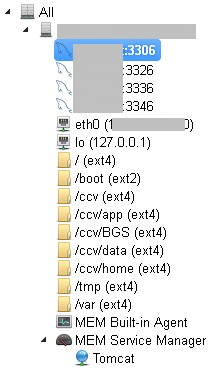 The new graph browser allows to choose the correspondent object from the left tree-view pane. You can see from the screenshot that now the agent collects data from the system and regroup the items differently, e.g. the filesystems are now separated objects belonging to the server.
New agent behavior
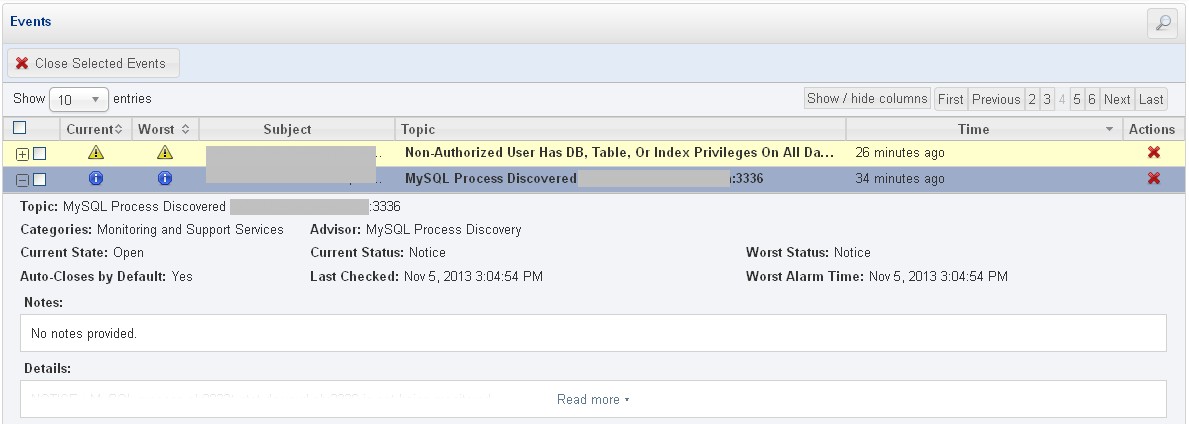
The new MySQL Enterprise Agent brings some benefits comparing to the old one. Now a single agent installation can monitor all database instances on the server and actively discover new ones.
When a new instance is discovered is not monitored by default: an event is raised so you can create an handle that sends you an email that reminds to enable the monitoring for that instance.
Other remarks
The Query Analyzer is now active by default for instances that have the performance_schema enabled.
Many new graphs are displayed by default providing great information on database statistics trends.
The Event Handling is simpler to manage IMO, but the only choices are still sending an email and/or an SNMP trap. I regret that it’s still impossible to take actions like hooking shell scripts or send WS calls.
The other functionalities are still present and basically unchanged.
Conclusion
Oracle have done a very good job in restyling everything. The new Enterprise Monitor dashboard is really responsive and I haven’t found bugs so far. But I have to say that there is still a lack of features that would make it really “enterprise ready”, such as a plugin mechanism that would allow to interact directly with common event management softwares like EM12c, Tivoli, Remedy or CA SM without relying on SNMP only. Also, it would be great to run actions directly when an event raises.
The POC however has been a complete success and we’ll start next week with the definitive migration! 🙂
Latest posts by Ludovico (see all)
- New views in Oracle Data Guard 23c - January 3, 2024
- New in Data Guard 21c and 23c: Automatic preparation of the primary - December 22, 2023
- Does FLASHBACK QUERY work across incarnations or after a Data Guard failover? - December 13, 2023
Any links to install MEM 4.0 (agentless monitoring)
For monitoring Amazon RDS look at https://dev.mysql.com/doc/mysql-monitor/3.2/en/mem-install-agent-cloud.html
Hi Ludovico,
The monitoring does not work after the message error. I’m trying to get kind of support from MySQL Forum. Any news I will post here. 😉
Thanks
Legatti
Hi Ludovico,
I’m trying to monitoring a MySQL RDS Instance on AWS using the MySQL Enterprise Monitor 3.0.15, but the the message below shows after finishing the configuration.
“Access denied; you need (at least one of) the SUPER privilege(s) for this operation”
Do you know how to solve this problem?
Thanks
Legatti
Hi Eduardo, I’m sorry, I’ve never configured it for RDS.
Does the monitoring work after that error? It may be related just to additional non-mandatory steps.
Any suggestions for third party Mysql Central management server and monitoring?
Do we have any script/solution available to gather information (database name, database size) from all servers?
No, seriously. MEM is good for monitoring, but I don’t know any good management framework as EM12c is for Oracle.
I use to run my own scripts locally (using Percona XtraBackup and mysqldump).
To gather information about databases I’ve used many solutions for different customers: custom php+rrd scripts, Zenoss, custom BMC Patrol KMs, ManageEngine, MEM but I’ve never been totally satisfied.
Enteprise Monitor, is it licensed product from Oracle? We are using Mysql Pythian Plugin to integrate with Oracle grid control. The drawback it it doesn’t give datbase size information.
What third party free tools do you suggest for Mysql Backups from Central location and mnitoring with datbase size information.
Pingback: First steps with MySQL Enterprise Monitor 3.0 - Ludovico Caldara - Blogs - triBLOG
I am using MONyog- MySQL Monitor for years and it has helpful features essential for DBAs.
It’s a good news that MEM v3.0 is now agentless now you can monitor MySQL servers without installing an Agent
Hi Mark,
I haven’t mentioned about agentless monitoring because we plan to install the agents on every server, but you’re right, it is a good improvement!
Thank you for the remark! 🙂