
This post is part of a blog series.
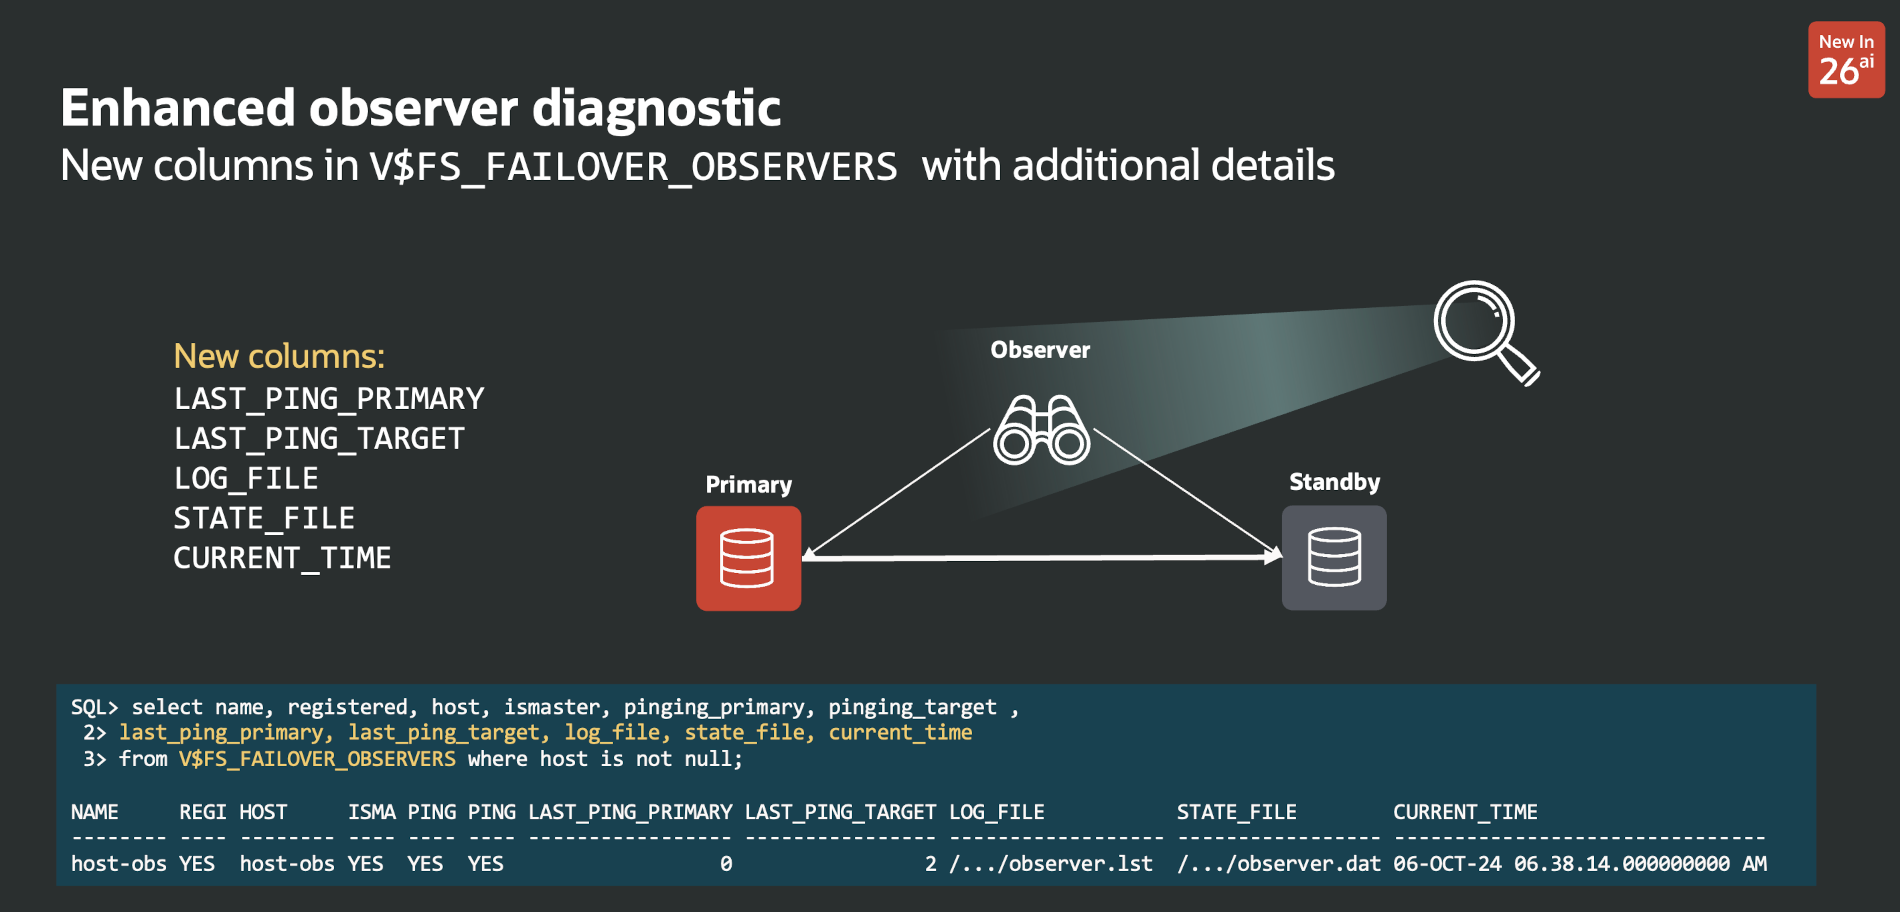
Another small but useful addition in Data Guard 26ai is a set of new columns in V$FS_FAILOVER_OBSERVERS:
- LAST_PING_PRIMARY
- LAST_PING_TARGET
- LOG_FILE
- STATE_FILE
- CURRENT_TIME
These columns give a bit more visibility into observer activity and configuration, which can help when checking Fast-Start Failover health or troubleshooting connectivity issues.
A simple query shows them:
|
1 2 3 4 5 6 7 8 |
select name, registered, host, ismaster, pinging_primary, pinging_target, last_ping_primary, last_ping_target, log_file, state_file, current_time from v$fs_failover_observers where host is not null; NAME REGI HOST ISMA PING PING LAST_PING_PRIMARY LAST_PING_TARGET LOG_FILE STATE_FILE CURRENT_TIME -------- ---- -------- ---- ---- ---- ----------------- ---------------- ------------------ ----------------- ------------------------------- host-obs YES host-obs YES YES YES 0 2 /.../observer.lst /.../observer.dat 06-OCT-24 06.38.14.000000000 AM |
This is particularly useful when there are multiple observers:
- if LAST_PING_PRIMARY increases, that observer may no longer be reaching the primary
- if LAST_PING_TARGET increases, the connectivity issue may be on the standby side
- if both increase, that observer may have lost connectivity more broadly
- LOG_FILE shows the path of the observer log file in use. Depending on your standards (or lack of), the location is not always the same.
- STATE_FILE shows the path of the observer state file
- CURRENT_TIME shows the time of the last update to the view
Overall, this is not a major feature, but it is a nice diagnostic improvement in 26ai and makes V$FS_FAILOVER_OBSERVERS a bit more informative.
The following two tabs change content below.


Latest posts by Ludovico (see all)
- Data Guard 26ai – #27: Enhanced Observer Diagnostics - April 16, 2026
- Data Guard 26ai – #26: Fast-Start Failover Lag Histogram - April 7, 2026
- Data Guard 26ai – #25: New view V$FAST_START_FAILOVER_CONFIG - April 2, 2026