
This post is part of a blog series.
Oracle Database 26ai introduces V$FS_LAG_HISTOGRAM, a new view that exposes the distribution of Fast-Start Failover (FSFO) lag.
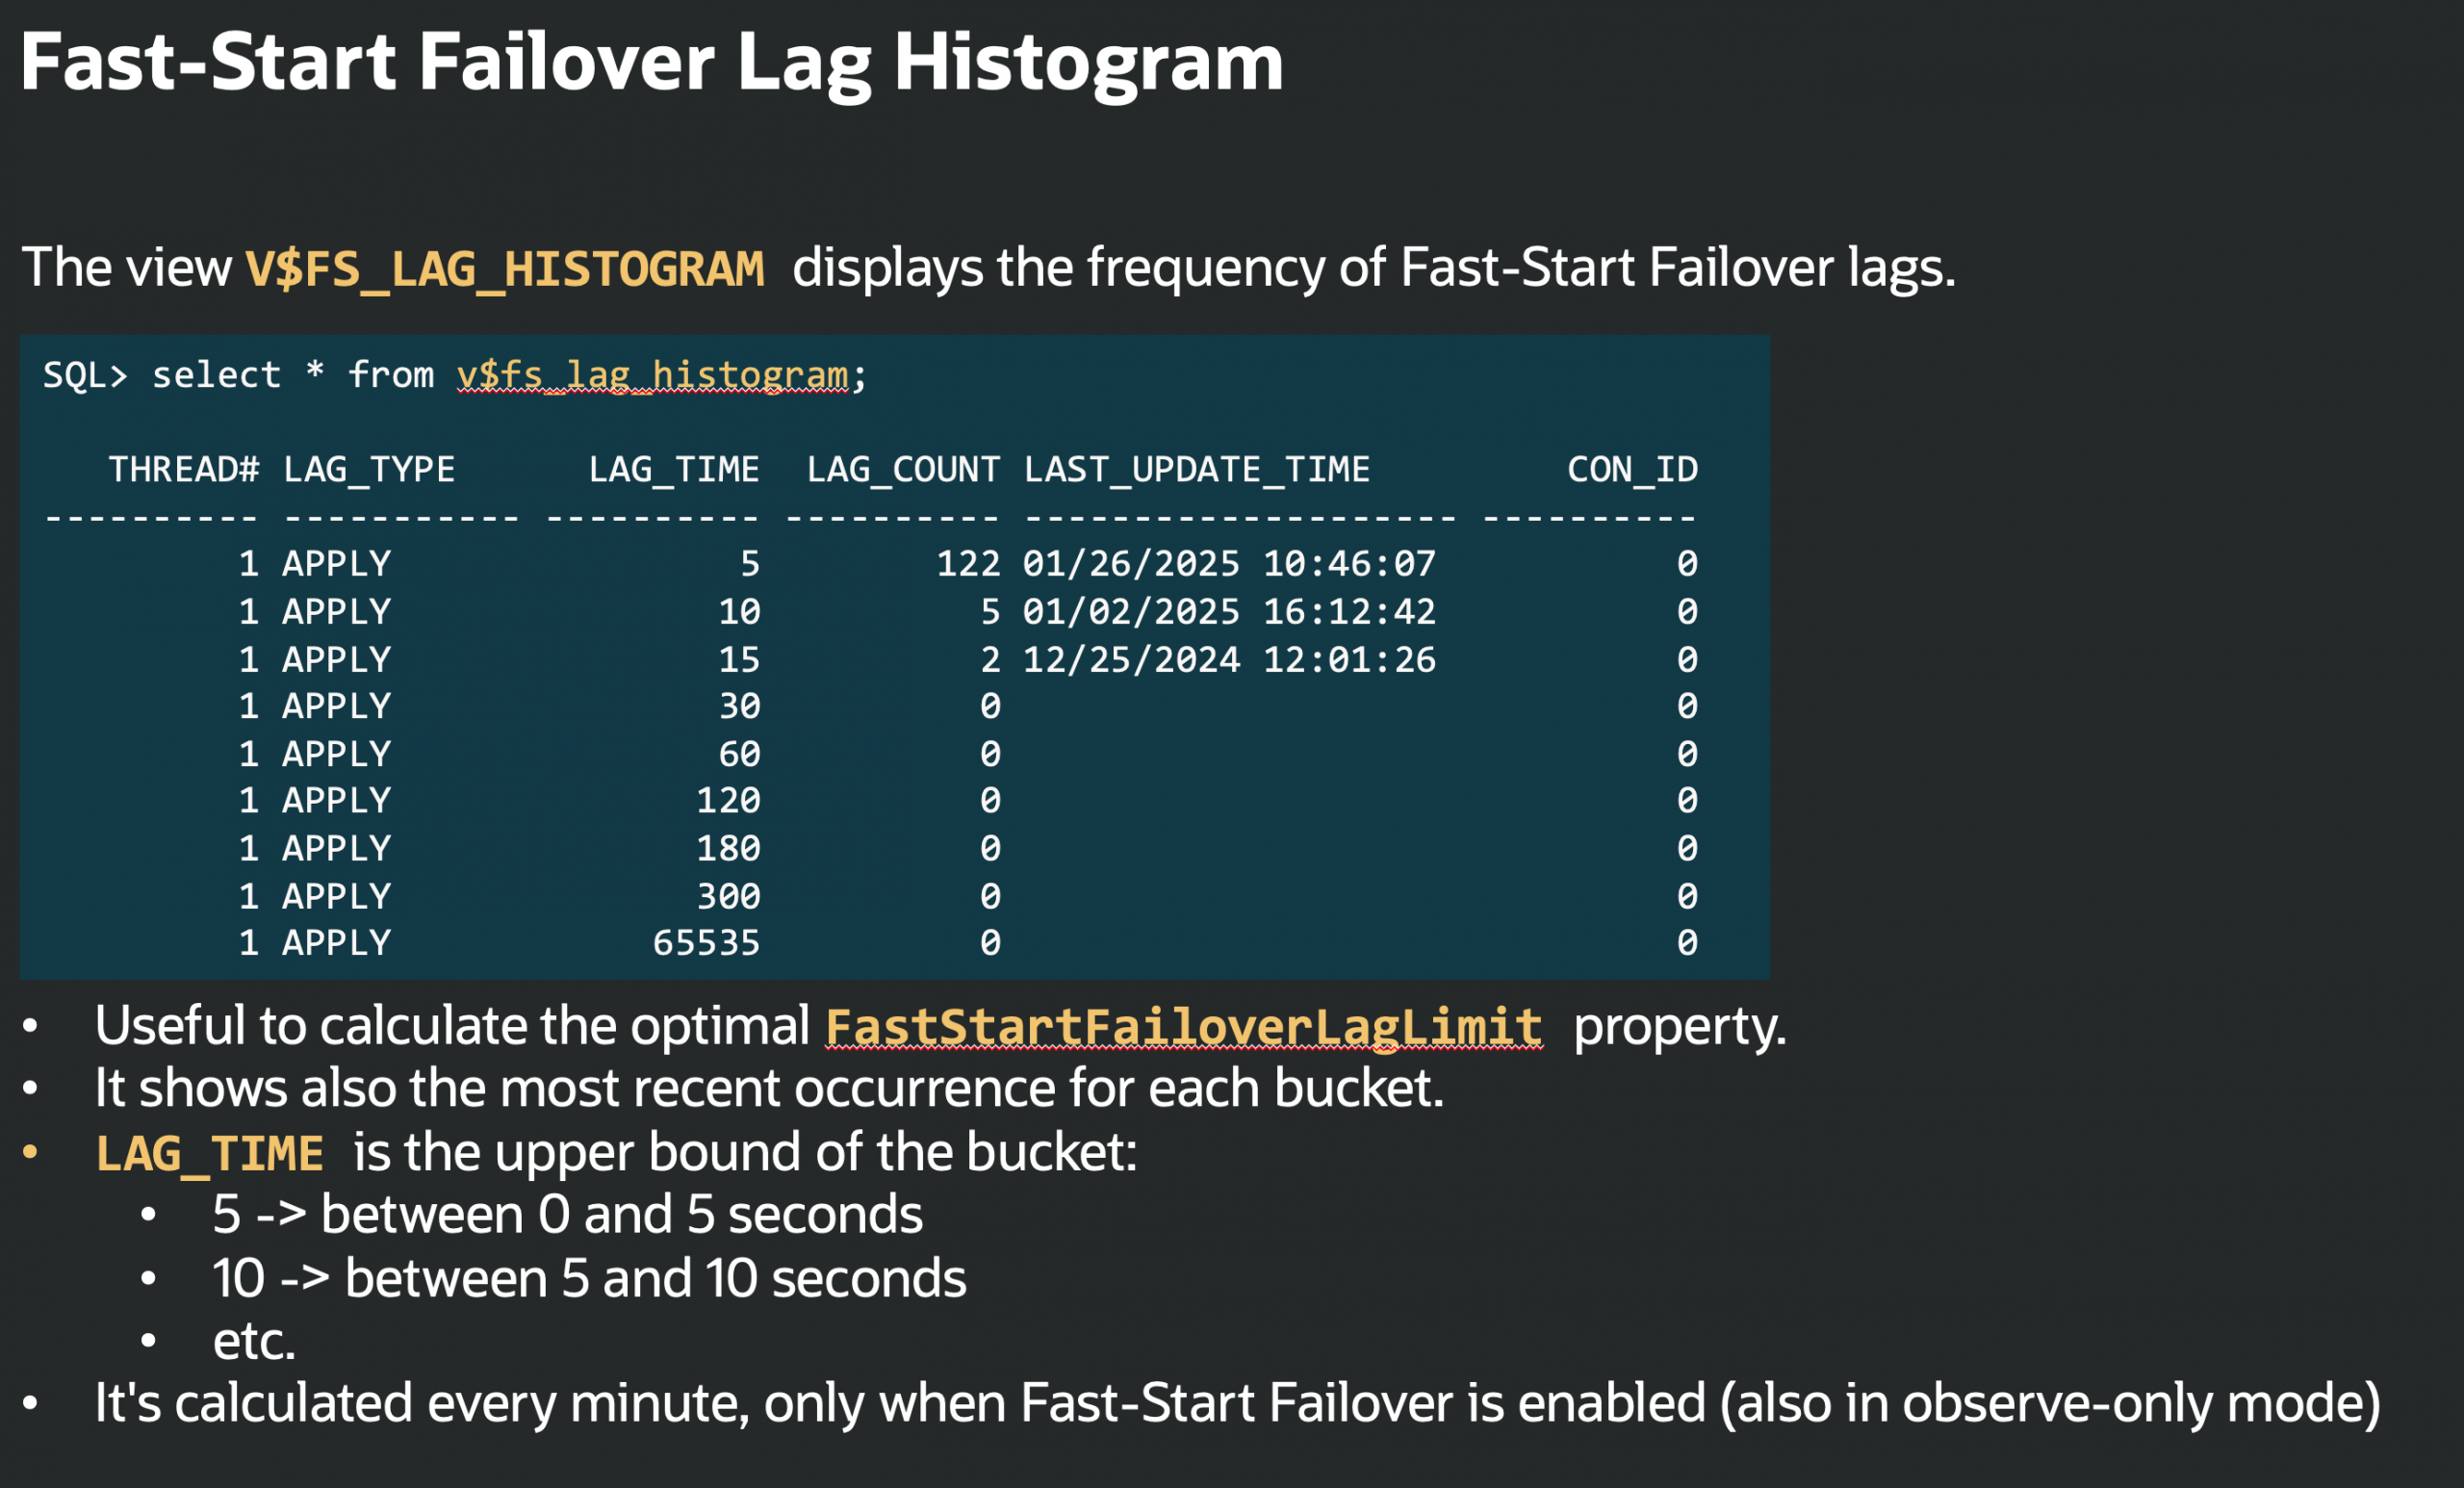
When FSFO is configured (including observe-only mode), it samples the lag every minute, and puts it into buckets to count how often each range occurs. The buckets can be queried from this new view:
|
1 2 3 4 5 6 7 8 9 10 11 12 |
SQL> SELECT * FROM V$FS_LAG_HISTOGRAM; THREAD# LAG_TYPE LAG_TIME LAG_COUNT LAST_UPDATE_TIME 1 APPLY 5 122 01/26/2025 10:46:07 1 APPLY 10 5 01/02/2025 16:12:42 1 APPLY 15 2 12/25/2024 12:01:26 1 APPLY 30 0 1 APPLY 60 0 1 APPLY 120 0 1 APPLY 180 0 1 APPLY 300 0 1 APPLY 65535 0 |
Where:
- LAG_TIME: upper bound of the bucket
- LAG_COUNT: number of occurrences
- LAST_UPDATE_TIME: most recent occurrence
So:
- 5 → 0–5 seconds
- 10 → 5–10 seconds
- 15 → 10–15 seconds
This view is particularly useful to tune FastStartFailoverLagLimit in Maximum Performance mode (ASYNC replication).
Why this matters:
Instead of relying on point-in-time lag or implementing external monitoring (which is still a good idea), you can analyze the actual distribution and choose a value that reflects your RPO: failover will not occur if lag exceeds this limit.
How to set the FastStartFailoverLagLimit based on the buckets
Use the histogram to understand the typical and peak lag behavior, then set FastStartFailoverLagLimit:
- Slightly above your normal/daily peak lag (if any)
- In line with your acceptable data-loss window (RPO)
- Less than or equal to FastStartFailoverThreshold
With proper setting, failovers are not unnecessarily prevented, while still respecting your data protection requirements.
Latest posts by Ludovico (see all)
- Data Guard 26ai – #26: Fast-Start Failover Lag Histogram - April 7, 2026
- Data Guard 26ai – #25: New view V$FAST_START_FAILOVER_CONFIG - April 2, 2026
- Data Guard 26ai – #24: Validate DGConnectIdentifier - March 13, 2026