This post is part of a blog series.
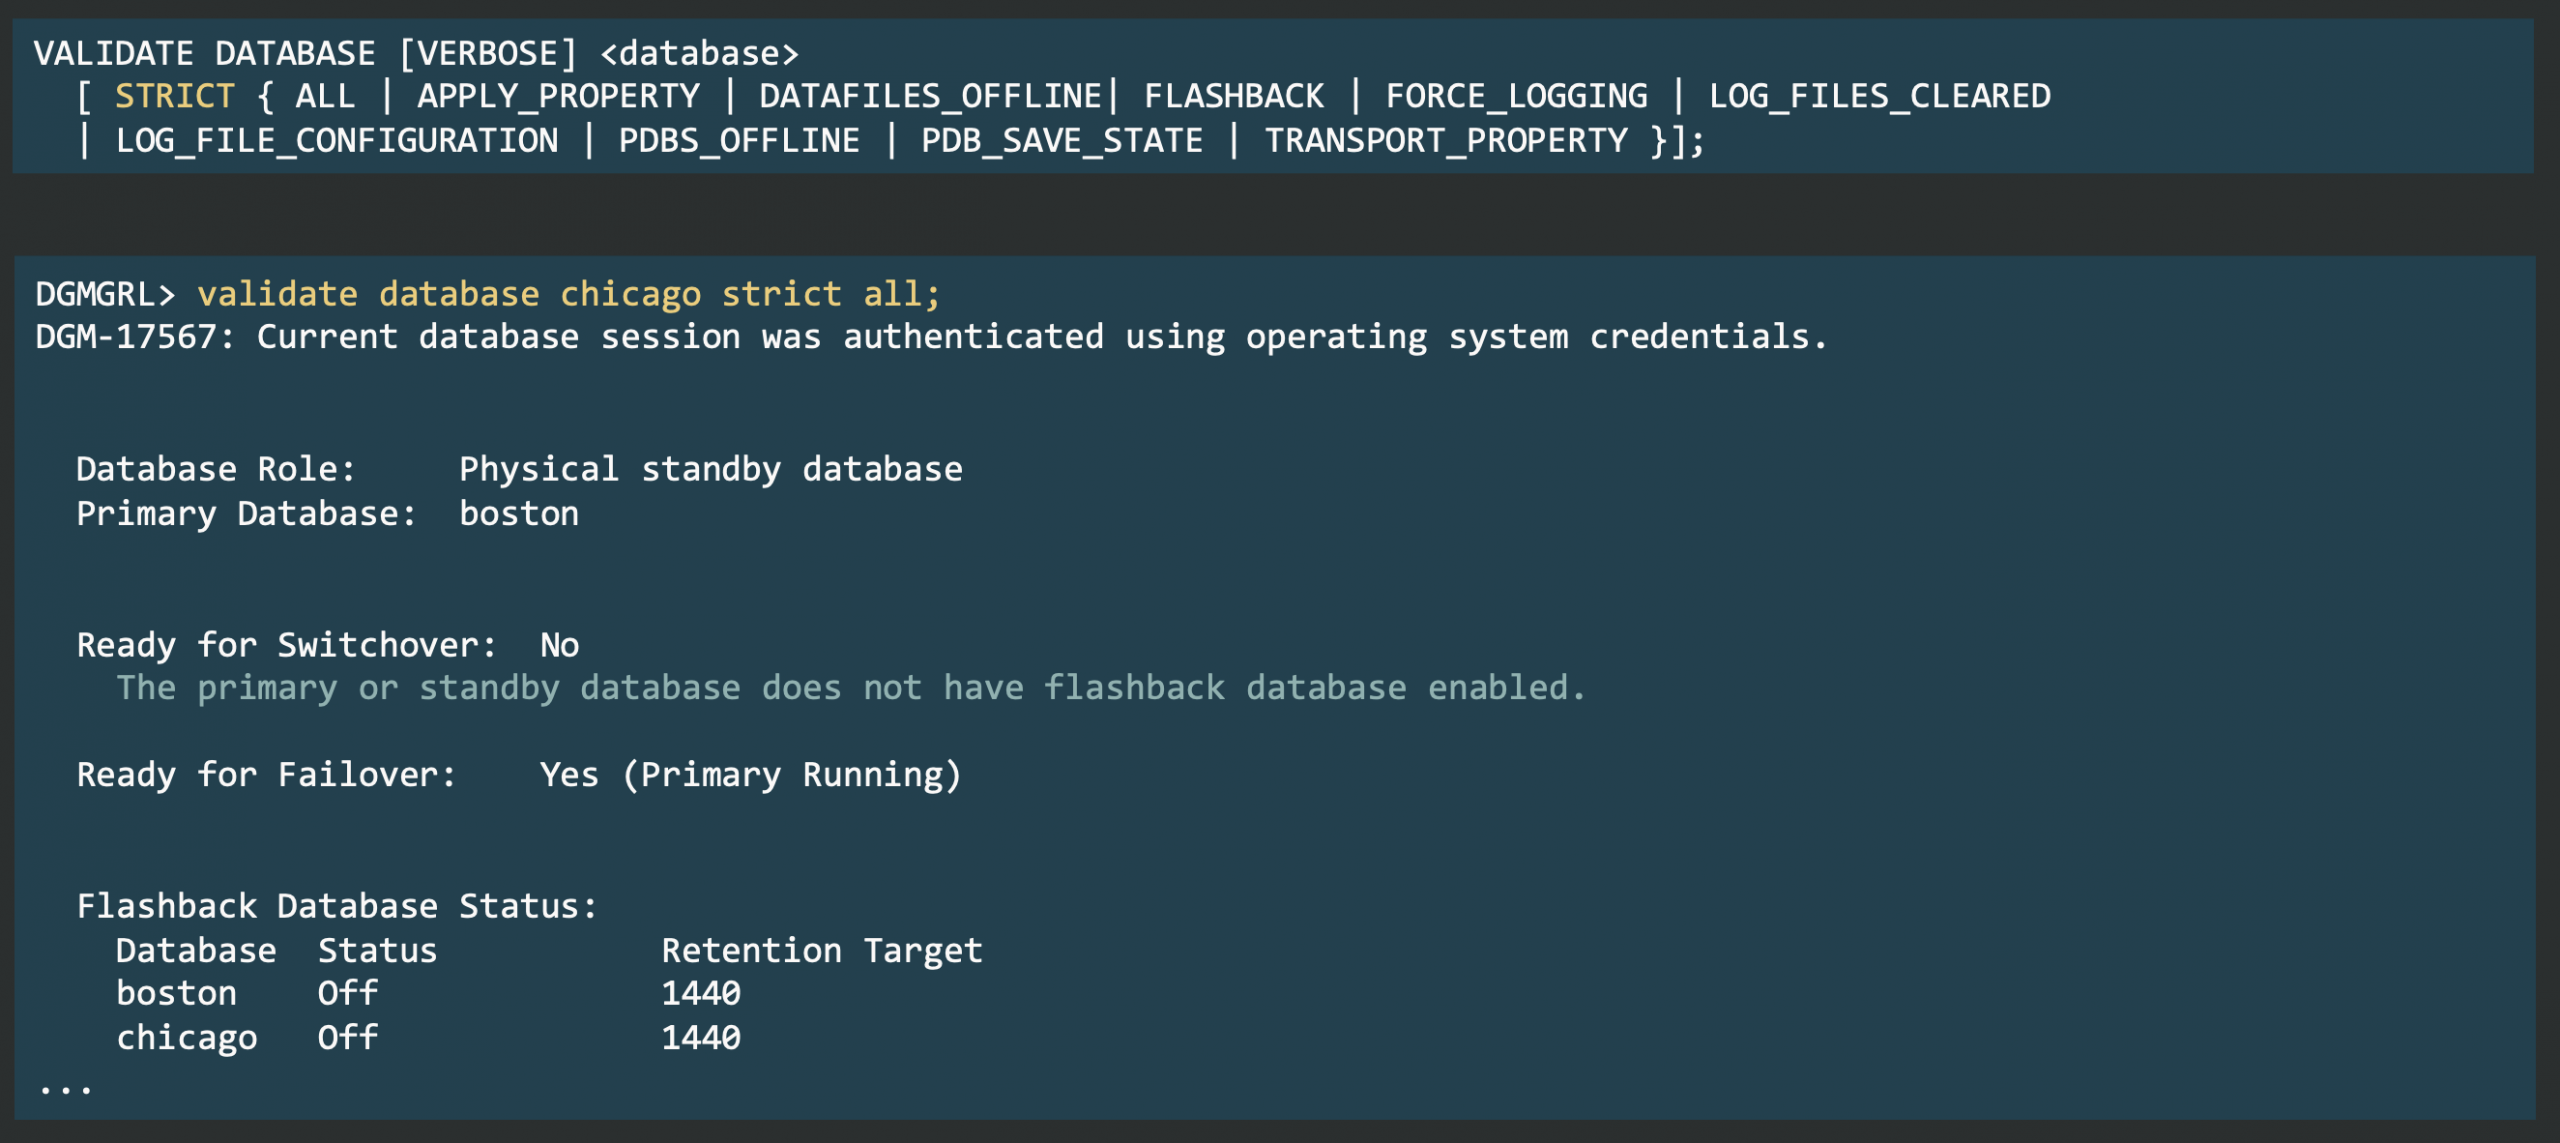
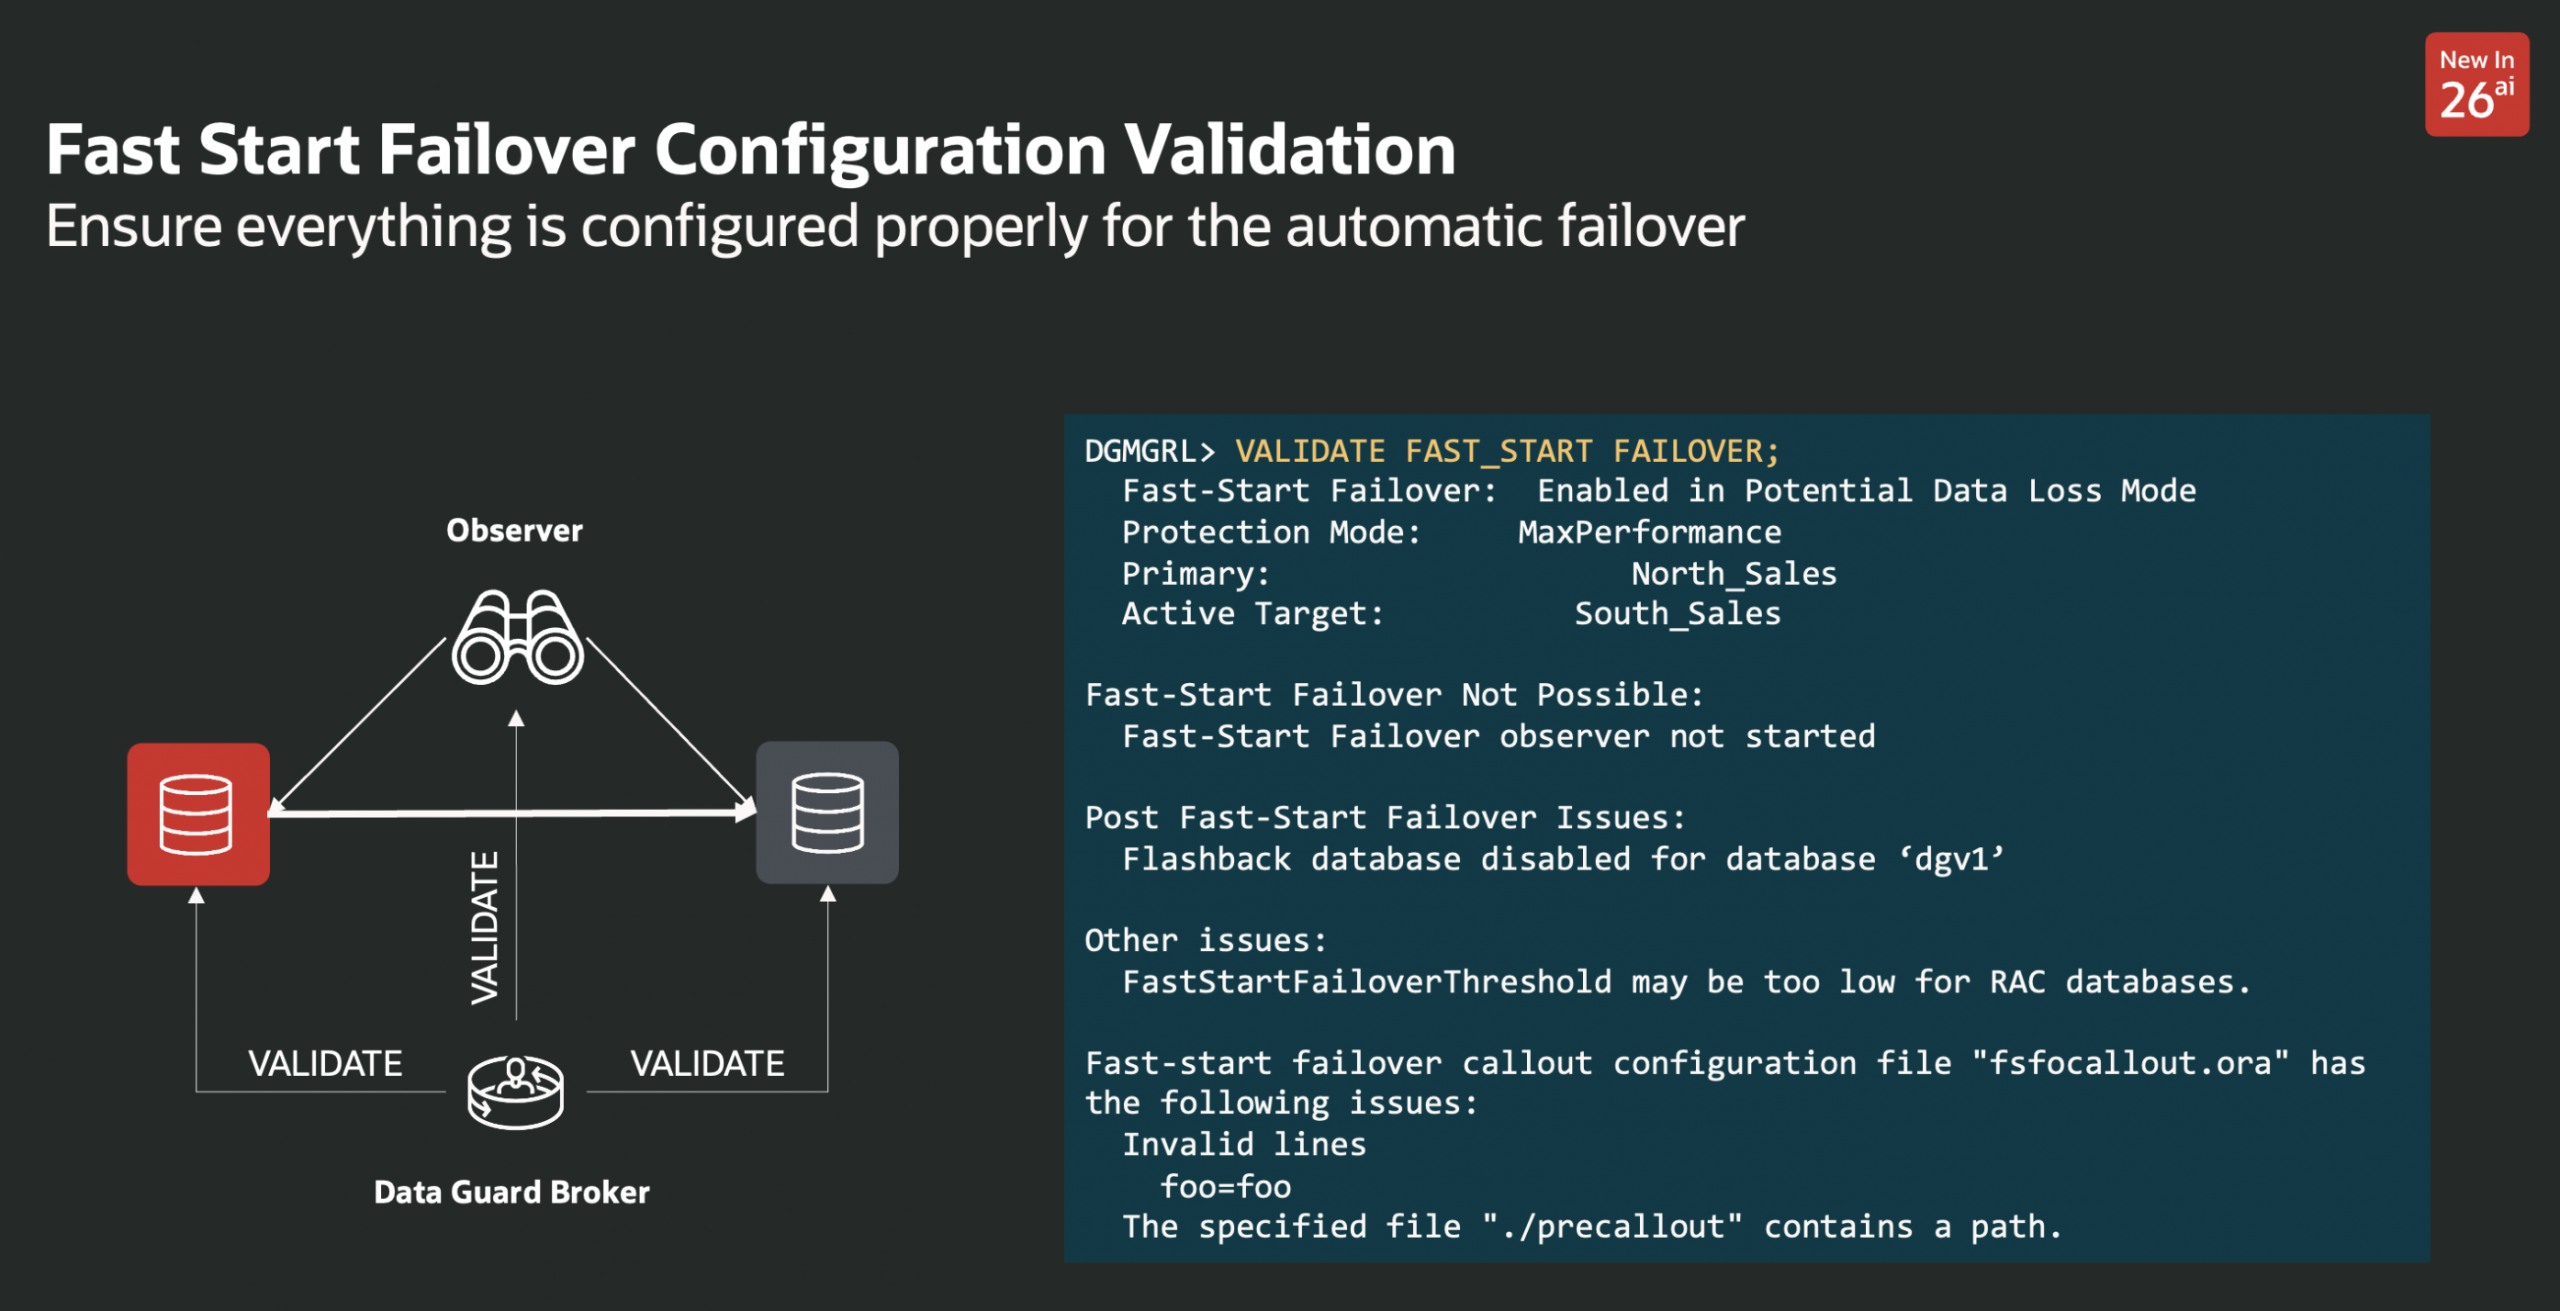
Oracle Data Guard 26ai introduces a new validation command for Fast-Start Failover (FSFO).
It provides a quick, comprehensive check of FSFO readiness across the configuration.
The command consolidates multiple internal checks and provides results in four areas.
1. FSFO Readiness Checks
Identifies conditions that directly affect FSFO operation:
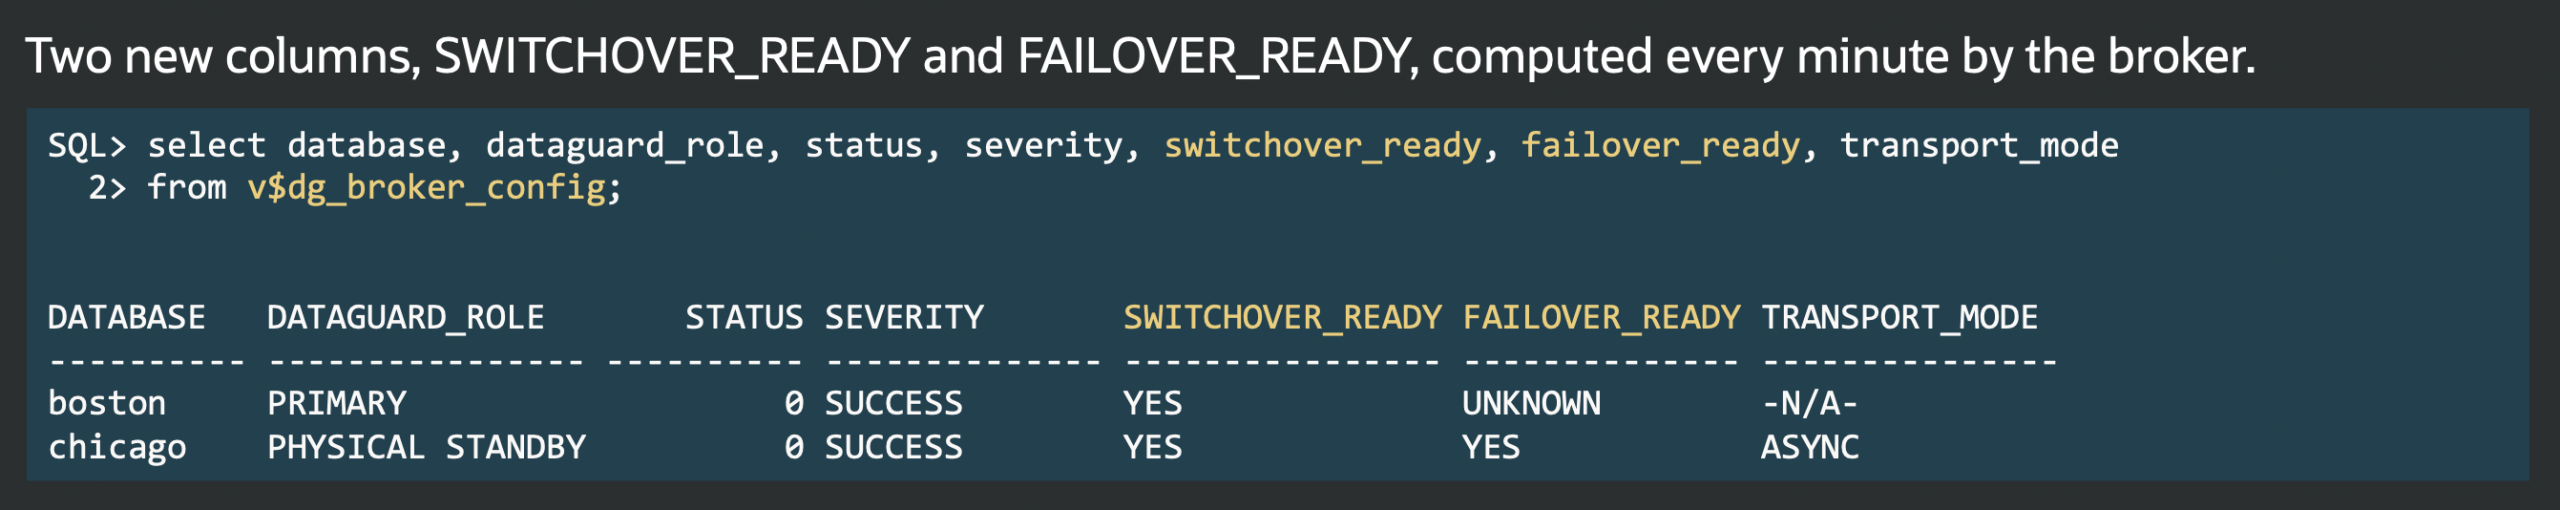
- FSFO state (enabled, observe-only, suspended)
- Transport synchronization for synchronous and asynchronous standbys
- Observer status and connectivity to the target
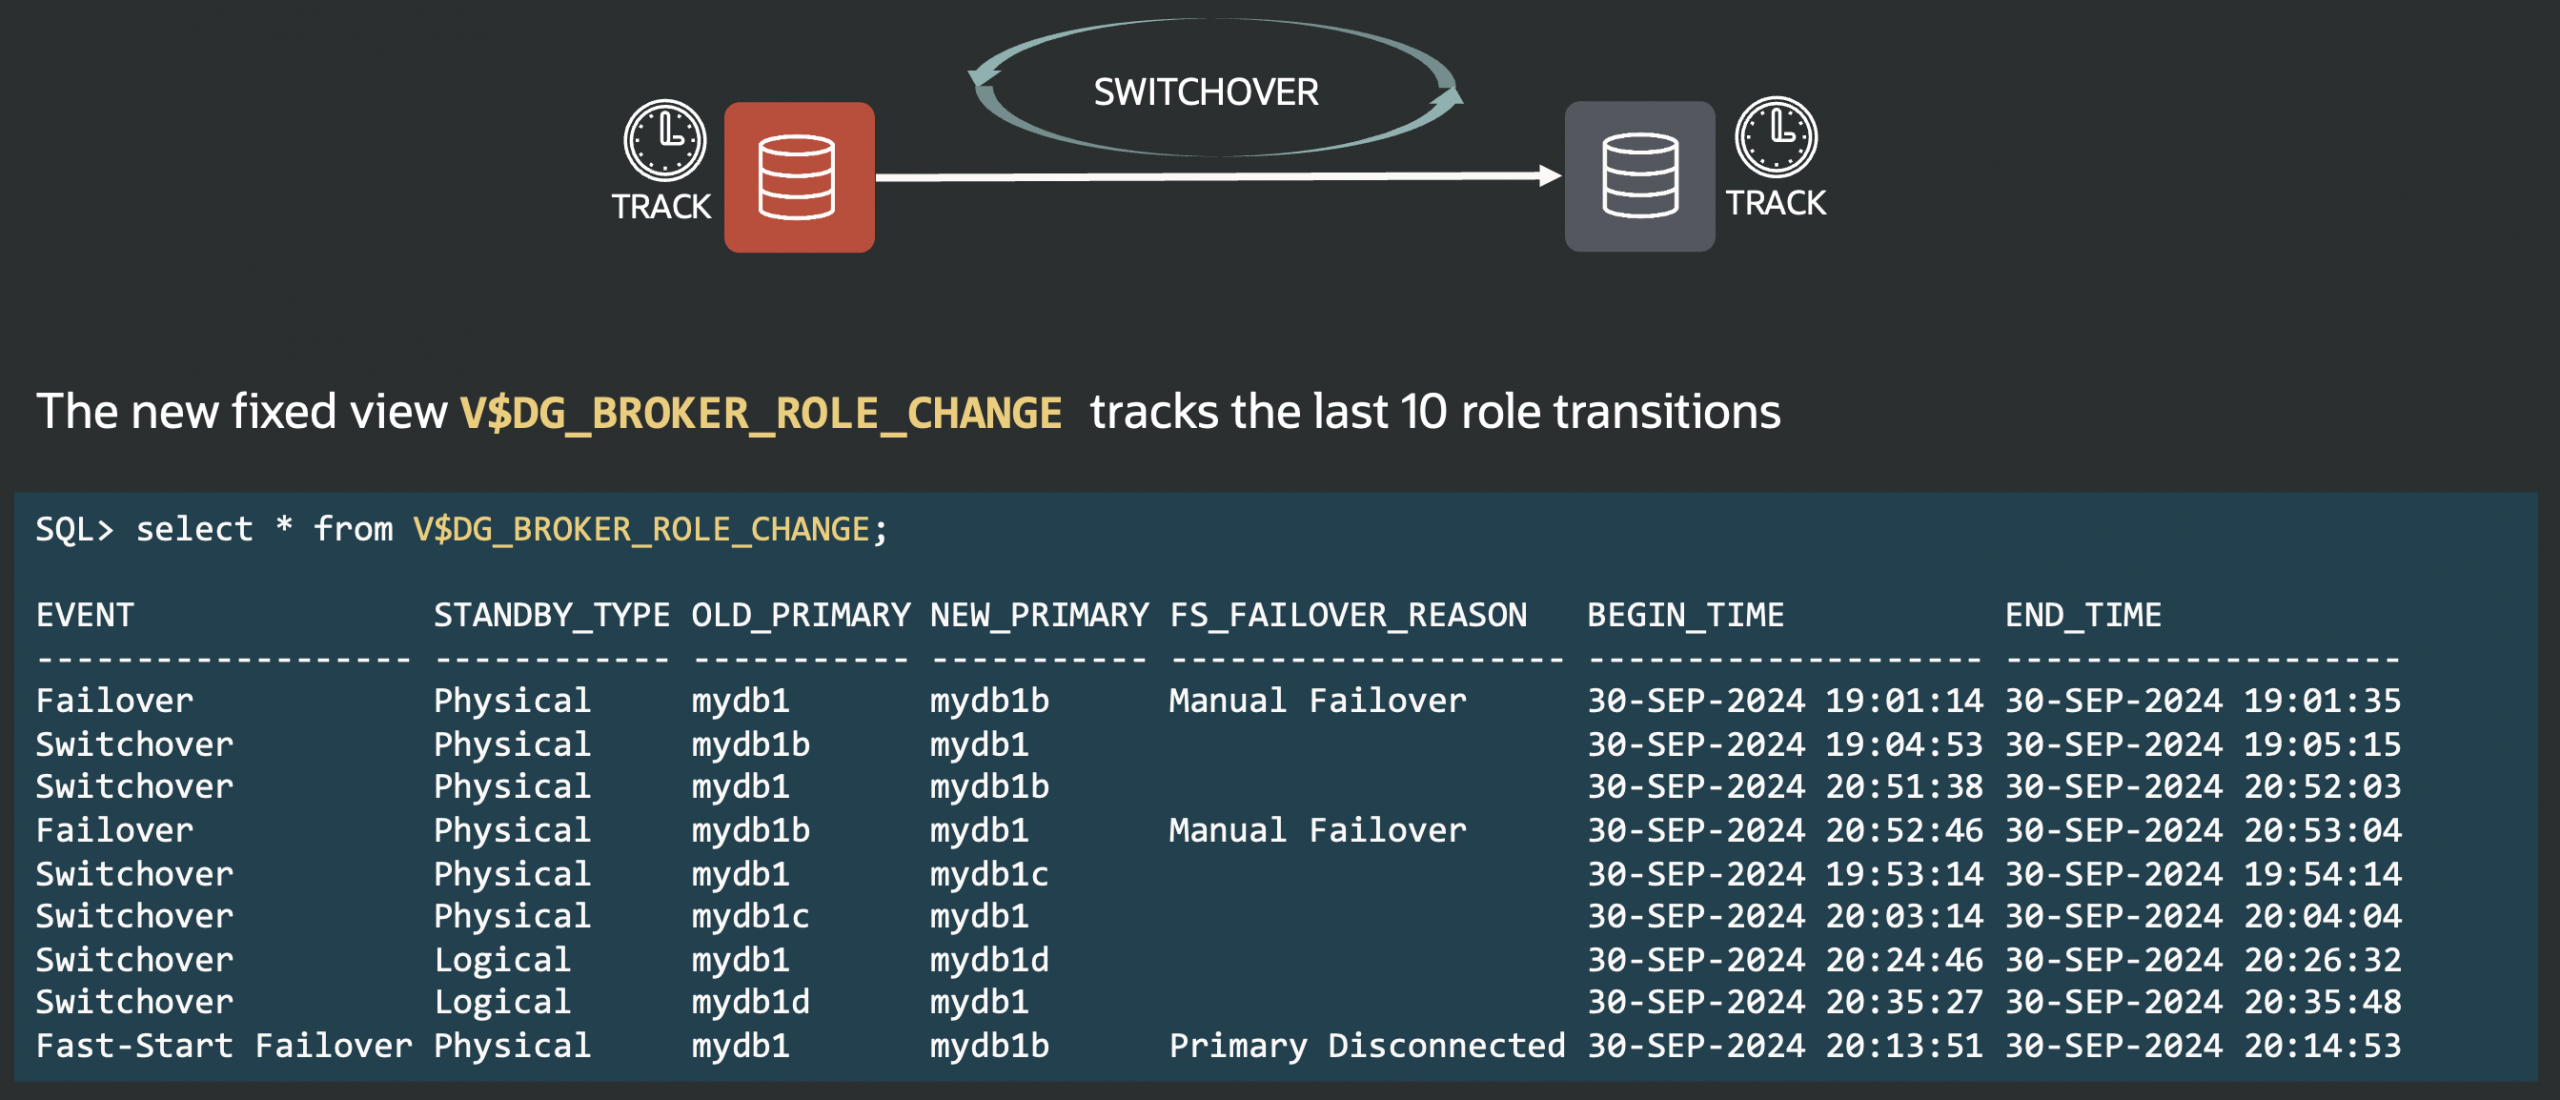
- Ongoing role transitions, reinstatements, and active observer changes
2. Post-Failover Consistency
Validates that the configuration remains consistent after a failover:
- Flashback enabled on the primary and designated target
- All potential future primaries define a valid
FastStartFailoverTarget, including cascaded configurations
3. Configuration Risk Indicators
Highlights parameter combinations that require attention:
- FSFO threshold relative to RAC requirements
- Alignment between
FastStartFailoverLagLimitandFastStartFailoverThreshold
4. Callout Validation
Inspects automation hooks associated with FSFO:
- Parses
fsfocallout.oraand related scripts and reports invalid entries
This command centralizes FSFO validation into a single operation.
It makes configuration state explicit, surfaces anomalies, and simplifies operational checks.
The result is a more predictable and verifiable FSFO setup, enabling automated and observable Data Guard environments.